Actual patterns
Patterns are graphical models which are formed in the chart by the price. According to one of the technical analysis postulates, history (price movement) repeats itself. It means that the price movements are often similar in the same situations which makes it possible to predict the further development of the situation with a high probability.
Actual Patterns
- All
- Double Top
- Flag
- Head and Shoulders
- Pennant
- Rectangle
- Triangle
- Triple top
- All
- #AAPL
- #AMZN
- #Bitcoin
- #EBAY
- #FB
- #GOOG
- #INTC
- #KO
- #MA
- #MCD
- #MSFT
- #NTDOY
- #PEP
- #TSLA
- #TWTR
- AUDCAD
- AUDCHF
- AUDJPY
- AUDUSD
- EURCAD
- EURCHF
- EURGBP
- EURJPY
- EURNZD
- EURRUB
- EURUSD
- GBPAUD
- GBPCHF
- GBPJPY
- GBPUSD
- GOLD
- NZDCAD
- NZDCHF
- NZDJPY
- NZDUSD
- SILVER
- USDCAD
- USDCHF
- USDJPY
- USDRUB
- All
- M5
- M15
- M30
- H1
- D1
- All
- Buy
- Sale
- All
- 1
- 2
- 3
- 4
- 5
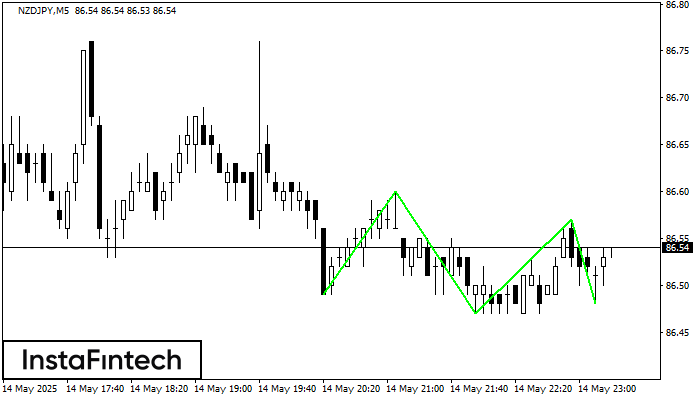
The Triple Bottom pattern has been formed on NZDJPY M5. It has the following characteristics: resistance level 86.60/86.57; support level 86.49/86.48; the width is 11 points. In the event
The M5 and M15 time frames may have more false entry points.
Open chart in a new window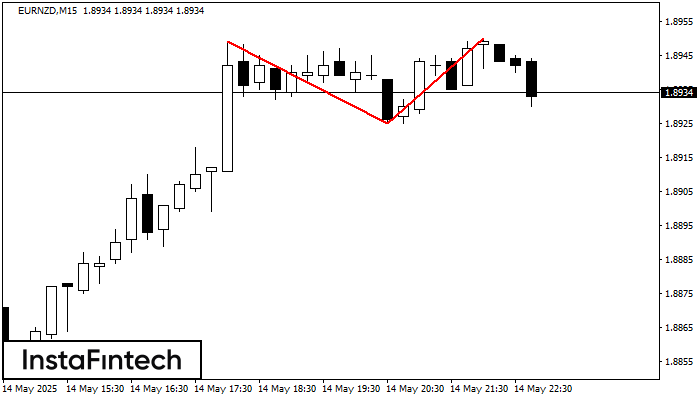
On the chart of EURNZD M15 the Double Top reversal pattern has been formed. Characteristics: the upper boundary 1.8950; the lower boundary 1.8925; the width of the pattern 25 points
The M5 and M15 time frames may have more false entry points.
Open chart in a new window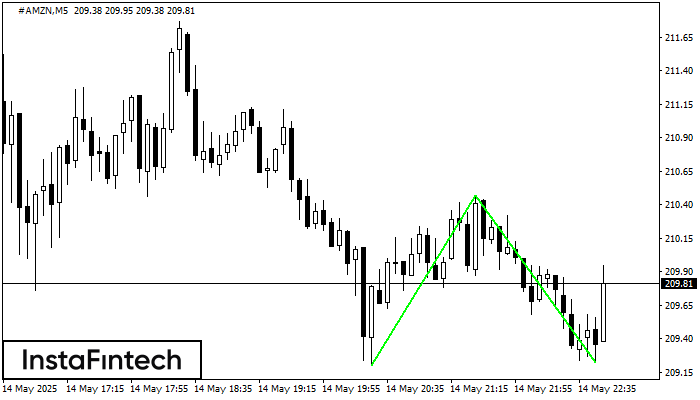
The Double Bottom pattern has been formed on #AMZN M5; the upper boundary is 210.47; the lower boundary is 209.22. The width of the pattern is 127 points. In case
The M5 and M15 time frames may have more false entry points.
Open chart in a new window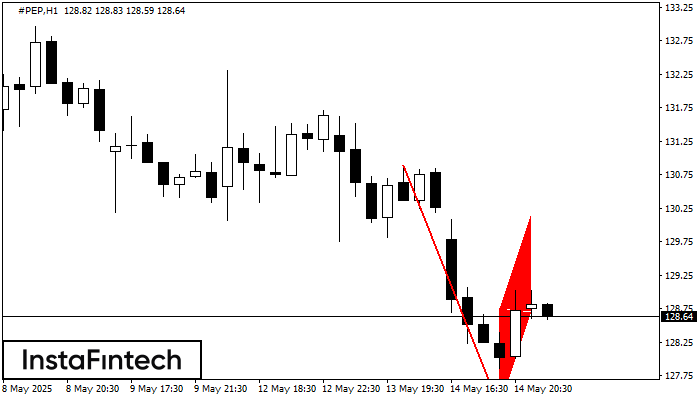
The Bearish Flag pattern has been formed on #PEP at H1. The lower boundary of the pattern is located at 127.29/128.71 while the upper boundary lies at 128.75/130.17. The projection
Open chart in a new window
The Bearish pennant pattern has formed on the #PEP H1 chart. It signals potential continuation of the existing trend. Specifications: the pattern’s bottom has the coordinate of 127.29; the projection
Open chart in a new window
The Bearish Flag pattern has been formed on the chart #PEP H1 which signals that the downward trend will continue. If the price breaks below the low at 127.29, then
Open chart in a new window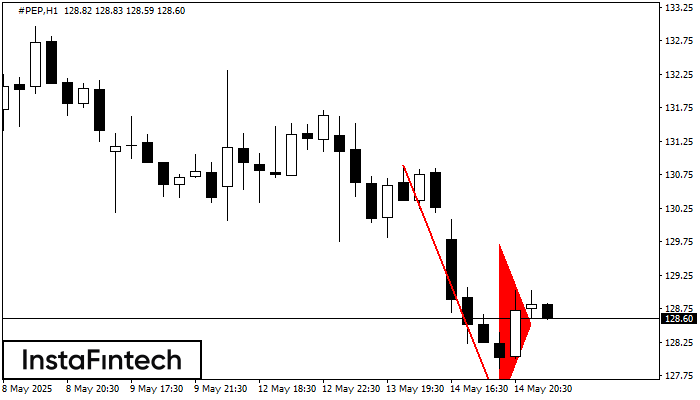
The Bearish pennant pattern has formed on the #PEP H1 chart. It signals potential continuation of the existing trend. Specifications: the pattern’s bottom has the coordinate of 127.29; the projection
Open chart in a new window
The Double Top reversal pattern has been formed on #TSLA M15. Characteristics: the upper boundary 349.70; the lower boundary 343.02; the width of the pattern is 669 points. Sell trades
The M5 and M15 time frames may have more false entry points.
Open chart in a new window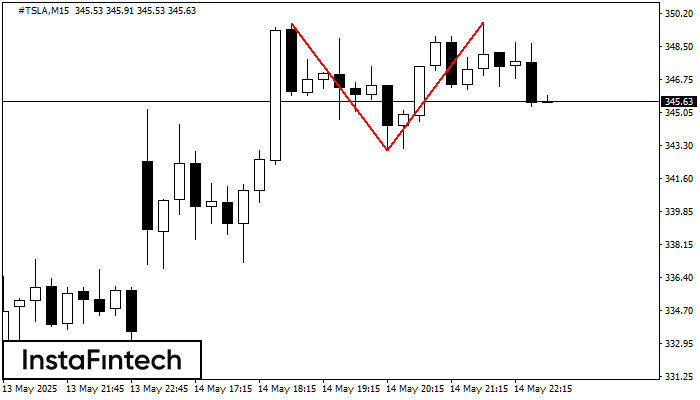
The Double Top reversal pattern has been formed on #TSLA M15. Characteristics: the upper boundary 349.70; the lower boundary 343.02; the width of the pattern is 669 points. Sell trades
The M5 and M15 time frames may have more false entry points.
Open chart in a new window