signal strength 2 of 5
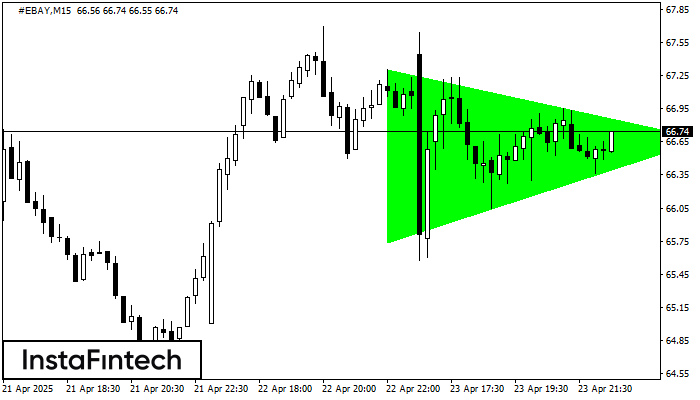
According to the chart of M15, #EBAY formed the Bullish Symmetrical Triangle pattern. Description: This is the pattern of a trend continuation. 67.31 and 65.74 are the coordinates of the upper and lower borders respectively. The pattern width is measured on the chart at 157 pips. Outlook: If the upper border 67.31 is broken, the price is likely to continue its move by 66.89.
The M5 and M15 time frames may have more false entry points.
- All
- Double Top
- Flag
- Head and Shoulders
- Pennant
- Rectangle
- Triangle
- Triple top
- All
- #AAPL
- #AMZN
- #Bitcoin
- #EBAY
- #FB
- #GOOG
- #INTC
- #KO
- #MA
- #MCD
- #MSFT
- #NTDOY
- #PEP
- #TSLA
- #TWTR
- AUDCAD
- AUDCHF
- AUDJPY
- AUDUSD
- EURCAD
- EURCHF
- EURGBP
- EURJPY
- EURNZD
- EURRUB
- EURUSD
- GBPAUD
- GBPCHF
- GBPJPY
- GBPUSD
- GOLD
- NZDCAD
- NZDCHF
- NZDJPY
- NZDUSD
- SILVER
- USDCAD
- USDCHF
- USDJPY
- USDRUB
- All
- M5
- M15
- M30
- H1
- D1
- All
- Buy
- Sale
- All
- 1
- 2
- 3
- 4
- 5
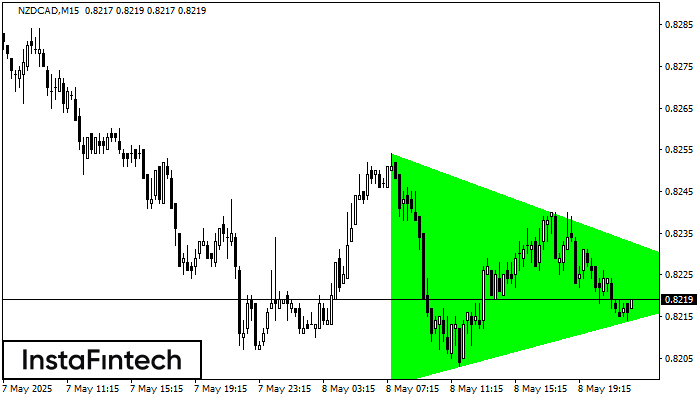
According to the chart of M15, NZDCAD formed the Bullish Symmetrical Triangle pattern. The lower border of the pattern touches the coordinates 0.8199/0.8222 whereas the upper border goes across 0.8254/0.8222
The M5 and M15 time frames may have more false entry points.
Open chart in a new window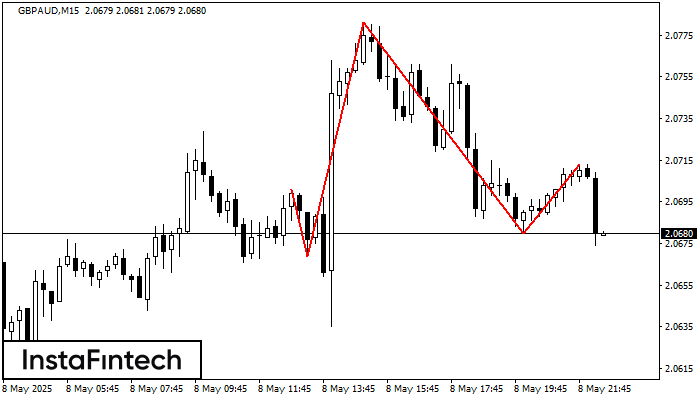
The technical pattern called Head and Shoulders has appeared on the chart of GBPAUD M15. There are weighty reasons to suggest that the price will surpass the Neckline 2.0669/2.0680 after
The M5 and M15 time frames may have more false entry points.
Open chart in a new window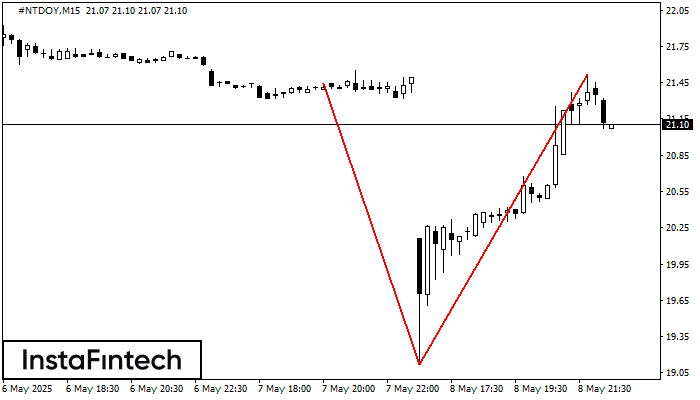
The Double Top pattern has been formed on #NTDOY M15. It signals that the trend has been changed from upwards to downwards. Probably, if the base of the pattern 19.12
The M5 and M15 time frames may have more false entry points.
Open chart in a new window