Actual patterns
Patterns are graphical models which are formed in the chart by the price. According to one of the technical analysis postulates, history (price movement) repeats itself. It means that the price movements are often similar in the same situations which makes it possible to predict the further development of the situation with a high probability.
Actual Patterns
- All
- Double Top
- Flag
- Head and Shoulders
- Pennant
- Rectangle
- Triangle
- Triple top
- All
- #AAPL
- #AMZN
- #Bitcoin
- #EBAY
- #FB
- #GOOG
- #INTC
- #KO
- #MA
- #MCD
- #MSFT
- #NTDOY
- #PEP
- #TSLA
- #TWTR
- AUDCAD
- AUDCHF
- AUDJPY
- AUDUSD
- EURCAD
- EURCHF
- EURGBP
- EURJPY
- EURNZD
- EURRUB
- EURUSD
- GBPAUD
- GBPCHF
- GBPJPY
- GBPUSD
- GOLD
- NZDCAD
- NZDCHF
- NZDJPY
- NZDUSD
- SILVER
- USDCAD
- USDCHF
- USDJPY
- USDRUB
- All
- M5
- M15
- M30
- H1
- D1
- All
- Buy
- Sale
- All
- 1
- 2
- 3
- 4
- 5
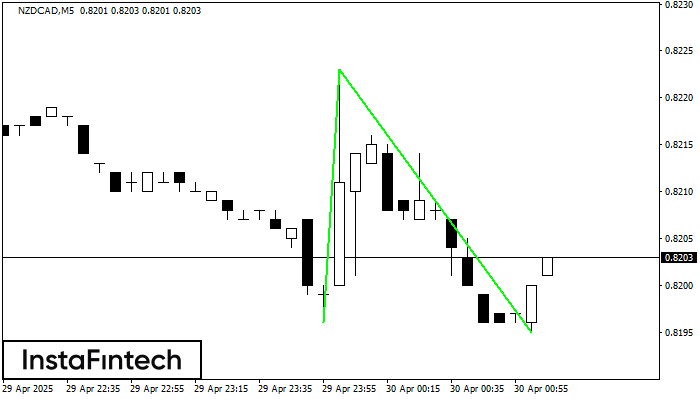
The Double Bottom pattern has been formed on NZDCAD M5; the upper boundary is 0.8223; the lower boundary is 0.8195. The width of the pattern is 27 points. In case
The M5 and M15 time frames may have more false entry points.
Open chart in a new window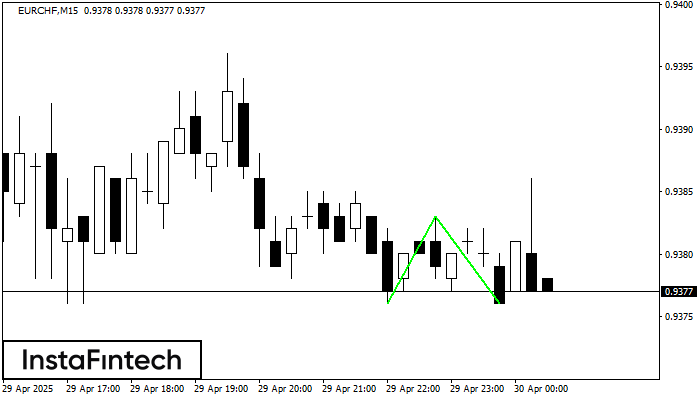
The Double Bottom pattern has been formed on EURCHF M15; the upper boundary is 0.9383; the lower boundary is 0.9376. The width of the pattern is 7 points. In case
The M5 and M15 time frames may have more false entry points.
Open chart in a new window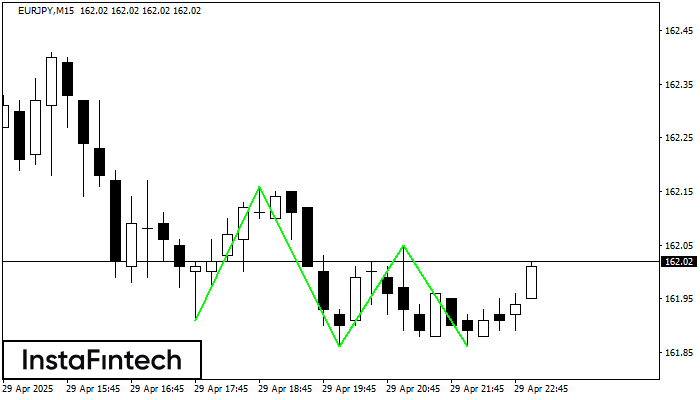
The Triple Bottom pattern has formed on the chart of the EURJPY M15 trading instrument. The pattern signals a change in the trend from downwards to upwards in the case
The M5 and M15 time frames may have more false entry points.
Open chart in a new window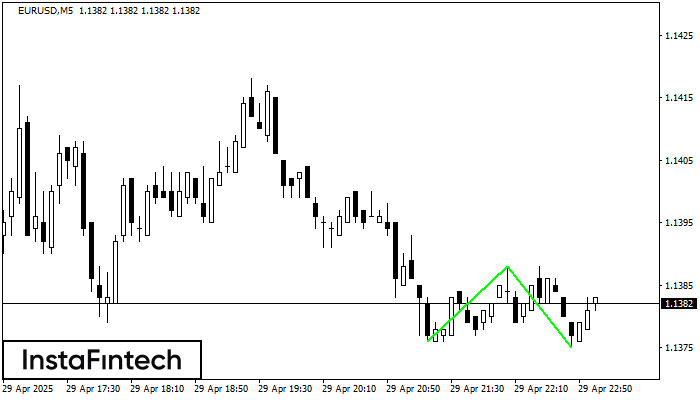
The Double Bottom pattern has been formed on EURUSD M5. This formation signals a reversal of the trend from downwards to upwards. The signal is that a buy trade should
The M5 and M15 time frames may have more false entry points.
Open chart in a new window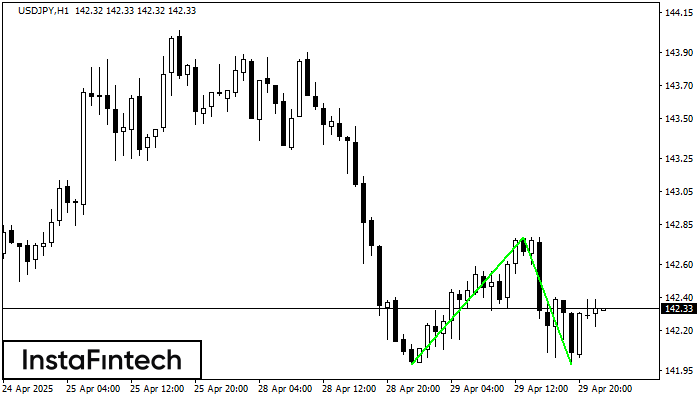
The Double Bottom pattern has been formed on USDJPY H1. Characteristics: the support level 141.99; the resistance level 142.77; the width of the pattern 78 points. If the resistance level
Open chart in a new window
The Double Top reversal pattern has been formed on #PEP M5. Characteristics: the upper boundary 134.35; the lower boundary 133.68; the width of the pattern is 69 points. Sell trades
The M5 and M15 time frames may have more false entry points.
Open chart in a new window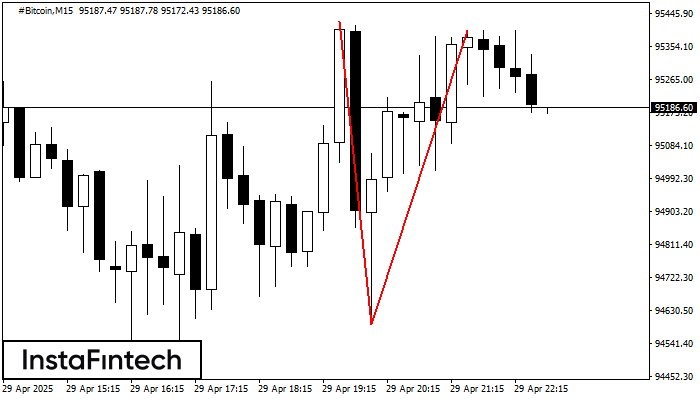
On the chart of #Bitcoin M15 the Double Top reversal pattern has been formed. Characteristics: the upper boundary 95399.01; the lower boundary 94594.52; the width of the pattern 80449 points
The M5 and M15 time frames may have more false entry points.
Open chart in a new window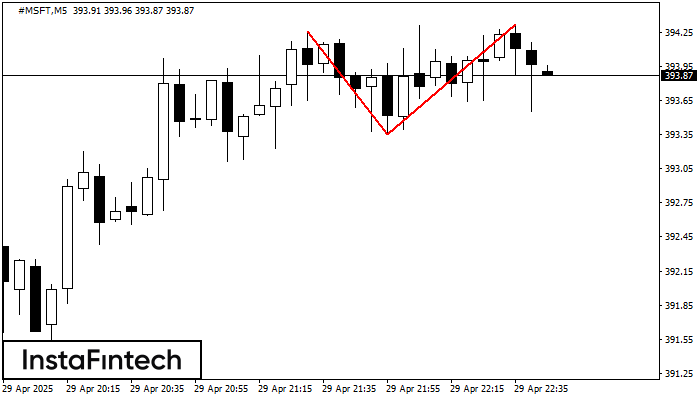
The Double Top pattern has been formed on #MSFT M5. It signals that the trend has been changed from upwards to downwards. Probably, if the base of the pattern 393.35
The M5 and M15 time frames may have more false entry points.
Open chart in a new window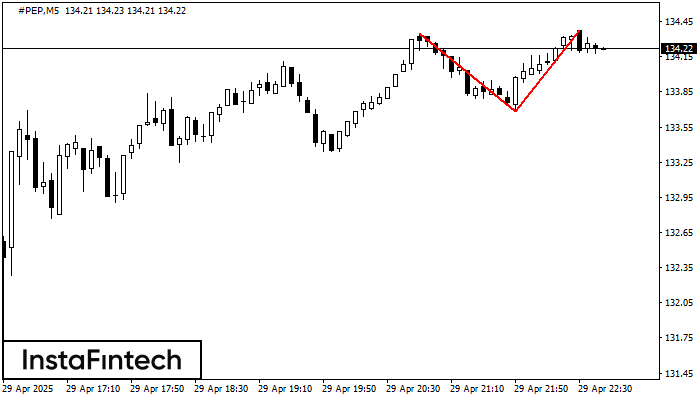
On the chart of #PEP M5 the Double Top reversal pattern has been formed. Characteristics: the upper boundary 134.37; the lower boundary 133.68; the width of the pattern 69 points
The M5 and M15 time frames may have more false entry points.
Open chart in a new window