signal strength 1 of 5
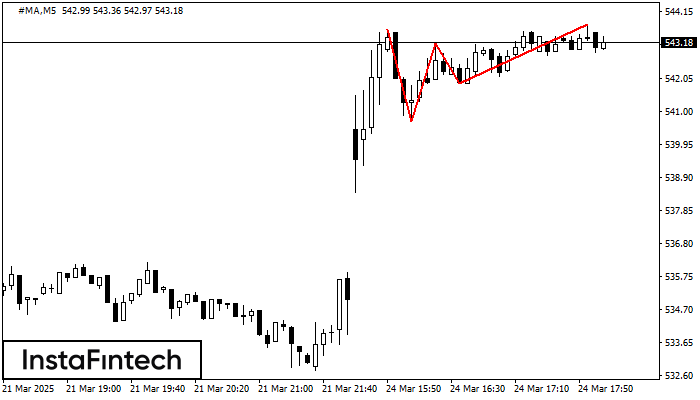
On the chart of the #MA M5 trading instrument, the Triple Top pattern that signals a trend change has formed. It is possible that after formation of the third peak, the price will try to break through the resistance level 540.68, where we advise to open a trading position for sale. Take profit is the projection of the pattern’s width, which is 291 points.
The M5 and M15 time frames may have more false entry points.
See Also
- All
- Double Top
- Flag
- Head and Shoulders
- Pennant
- Rectangle
- Triangle
- Triple top
- All
- #AAPL
- #AMZN
- #Bitcoin
- #EBAY
- #FB
- #GOOG
- #INTC
- #KO
- #MA
- #MCD
- #MSFT
- #NTDOY
- #PEP
- #TSLA
- #TWTR
- AUDCAD
- AUDCHF
- AUDJPY
- AUDUSD
- EURCAD
- EURCHF
- EURGBP
- EURJPY
- EURNZD
- EURRUB
- EURUSD
- GBPAUD
- GBPCHF
- GBPJPY
- GBPUSD
- GOLD
- NZDCAD
- NZDCHF
- NZDJPY
- NZDUSD
- SILVER
- USDCAD
- USDCHF
- USDJPY
- USDRUB
- All
- M5
- M15
- M30
- H1
- D1
- All
- Buy
- Sale
- All
- 1
- 2
- 3
- 4
- 5
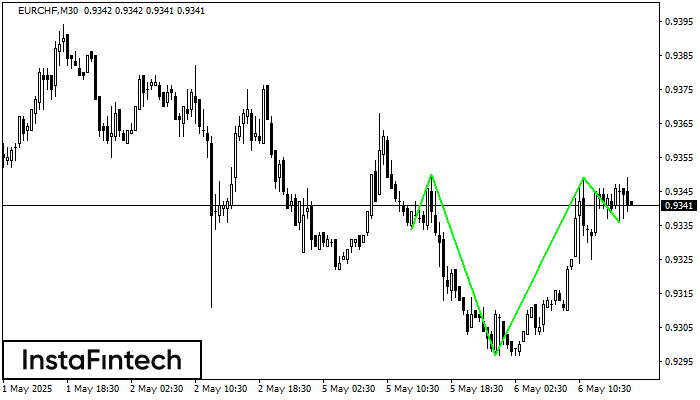
According to M30, EURCHF is shaping the technical pattern – the Inverse Head and Shoulder. In case the Neckline 0.9350/0.9349 is broken out, the instrument is likely to move toward
Open chart in a new window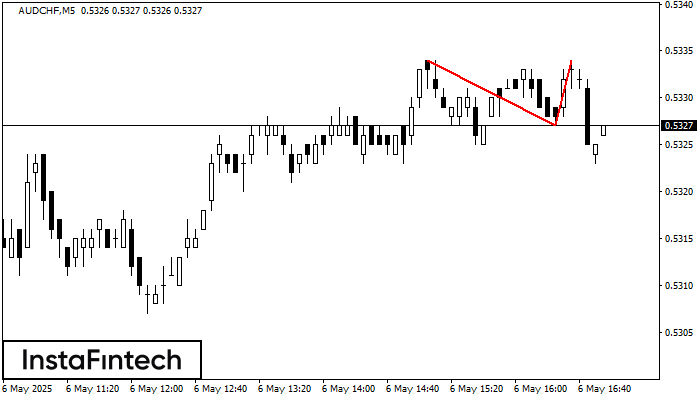
The Double Top reversal pattern has been formed on AUDCHF M5. Characteristics: the upper boundary 0.5334; the lower boundary 0.5327; the width of the pattern is 7 points. Sell trades
The M5 and M15 time frames may have more false entry points.
Open chart in a new window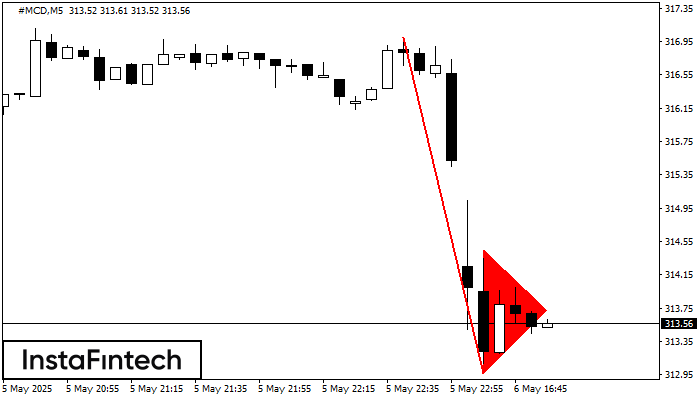
The Bearish pennant pattern has formed on the #MCD M5 chart. The pattern signals continuation of the downtrend in case the pennant’s low of 312.97 is broken through. Recommendations: Place
The M5 and M15 time frames may have more false entry points.
Open chart in a new window