EUR/USD
Analysis:
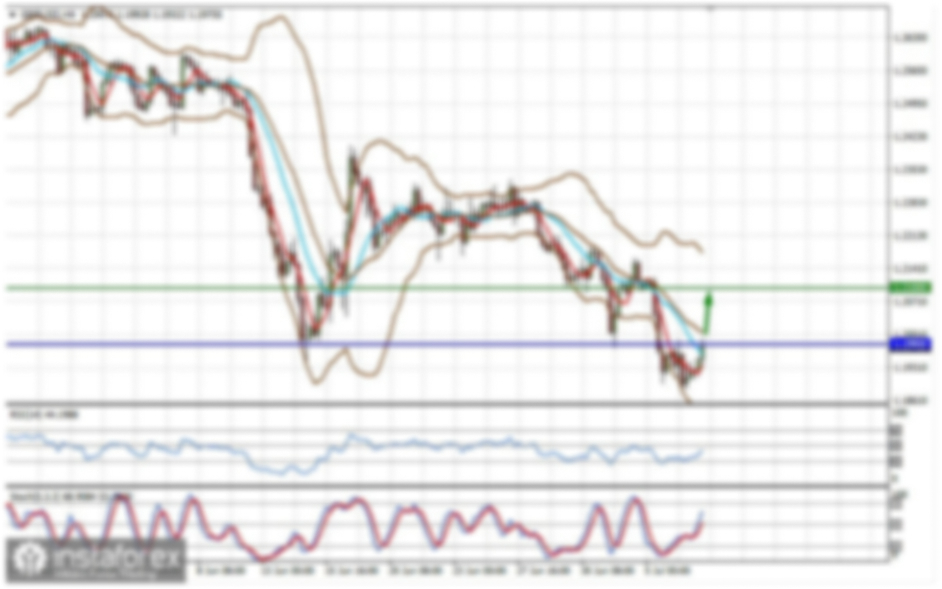
The short-term trend direction for the euro major pair is driven by an incomplete bearish wave from August 26. Within this wave structure, the corrective segment (B) is currently developing and remains unfinished. Over recent weeks, the price has largely moved sideways within a defined price range.
Forecast:
In the early days of the week, price fluctuations for the euro are expected to show a sideways bias with an upward tendency. Price growth is not likely to exceed the calculated resistance level. Increased volatility, a reversal, and a return to price declines are expected closer to the weekend.
Potential Reversal Zones:
- Resistance: 1.0600–1.0650
- Support: 1.0380–1.0330
Recommendations:
- Sell: Enter trades after confirmed reversal signals near the resistance zone according to your trading systems (TS).
- Buy: Possible with fractional volume sizes within individual sessions, limited to the calculated resistance level.
USD/JPY
Analysis:
The main direction of the intraday trends for the yen pair is dictated by an incomplete upward shifting wave. The corrective phase within this structure is nearing completion. At the end of last week, the price broke through a strong resistance level, which has since become robust support.
Forecast:
For the next couple of days, the pair is expected to trade sideways within a price corridor defined by the nearest opposing zones. Temporary pressure towards the calculated support zone is possible. A resumption of bullish momentum is likely closer to the weekend, with the calculated resistance serving as the upper boundary of the weekly movement.
Potential Reversal Zones:
- Resistance: 156.50–157.00
- Support: 152.80–152.30
Recommendations:
- Sell: Possible during individual sessions, but due to limited potential, fractional volume sizes are safer.
- Buy: Become relevant after confirmed reversal signals near the support zone.
GBP/JPY
Analysis:
The current wave structure of the GBP/JPY pair appears as a horizontal ascending extended wave, starting from late September. The initial stage of the final segment (C) has been developing over the last two weeks.
Forecast:
This week, the pair is likely to exhibit a sideways movement pattern. In the early days, pressure on the resistance zone may persist. A change in direction is anticipated towards the weekend. The week's decline is unlikely to go beyond the calculated support.
Potential Reversal Zones:
- Resistance: 194.70–195.20
- Support: 190.60–190.10
Recommendations:
- Buy: High risk and limited potential.
- Sell: Consider trades after confirmed reversal signals near the resistance zone.
USD/CAD
Analysis:
The current wave structure for the Canadian dollar is incomplete and upward-directed, starting from September 25. The final segment (C) is in progress. The price is approaching the upper boundary of the daily timeframe's potential reversal zone, with no signs of an imminent reversal yet.
Forecast:
An upward trend is expected in the early part of the week, potentially reaching the resistance zone. A reversal and the start of a downward trend are likely to follow. The support zone indicates the lower boundary of the anticipated weekly range.
Potential Reversal Zones:
- Resistance: 1.4270–1.4320
- Support: 1.4090–1.4040
Recommendations:
- Buy: Low potential and risky.
- Sell: Enter trades after confirmed reversal signals near the resistance zone.
NZD/USD
Analysis:
Since late October, the NZD/USD pair has been trending downward. The structure is incomplete and requires a corrective phase to resume the wave. The price is nearing the lower boundary of a significant reversal zone on the weekly timeframe.
Forecast:
In the early part of the week, a continuation of the sideways movement with a downward bias is likely, potentially driving the price toward the support zone. A reversal and upward movement could occur closer to the weekend or next week.
Potential Reversal Zones:
- Resistance: 0.5890–0.5940
- Support: 0.5750–0.5700
Recommendations:
- Buy: Premature until confirmed reversal signals appear near the support zone.
- Sell: Low potential and risky.
Gold
Analysis:
For the past two years, the gold market's short-term trend has been driven by a bullish wave. Since late October, a counter-wave has been forming, but its potential remains within a corrective scope. The final segment (C) of this wave structure is incomplete.
Forecast:
Early in the week, sideways movement with an upward bias is expected until the rise is fully completed in the resistance zone. By the weekend, a reversal and renewed decline are likely, extending toward the support zone.
Potential Reversal Zones:
- Resistance: 2690.0–2710.0
- Support: 2570.0–2550.0
Recommendations:
- Buy: No favorable conditions expected in the near term.
- Sell: Possible from the resistance zone during individual sessions after confirmed reversal signals from your trading systems.
Explanatory Notes
- In simplified wave analysis (SWA), all waves consist of three parts (A-B-C). The analysis focuses on the last incomplete wave across each timeframe.
- Dashed lines represent anticipated movements.
- Important: The wave algorithm does not account for the duration of instrument movements over time.