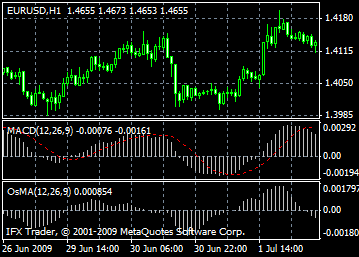
Technical Indicator Moving Average Convergence/Divergence (MACD) is the next trend-following dynamic indicator. It indicates the correlation between two price moving averages.
The Moving Average Convergence/Divergence Technical Indicator is constructed on the difference between moving averages with 26-period and 12-period. For indicating the most advantageous moments the signal line (9-period indicators` moving average) is inserted on the MACD.
The MACD is better to use in wide-swinging trading market. e Moving Average Convergence/Divergence usually gives signals if crossing or divergence take place and in the overbought/oversold condition.
Crossing
The basic MACD trading rule is based on the crossing of the indicator with it signal line. When MACD falls below its signal line it is time to sell, when MACD rises above its signal line it is time to buy. Buy or sell when the MACD goes above or below zero.
Overbought/oversold conditions
Average Convergence/Divergence is also useful for overbought/oversold condition indication. When the MACD rises, it means that the price is overvalued and will soon return to the more realistic levels.
Divergence
An indication that the current trend is expected to be completed occurs when the MACD diverges from the price. A bullish divergence takes place when the price reaches new maximums and at the same time the Moving Average Convergence/Divergence indicator fails to reach new highs. A bearish convergence is formed when the price makes a new low and the MACD fails to do it. Both types of divergence are very important if they occur in the overbought/oversold area.
Technical Indicator Moving Average of Oscillator (OsMA) – it is a difference between an oscillator and oscillator smoothing. In this case, the main line MACD is used as oscillator and signal line as oscillator smoothing.

MACD calculation
The MACD is calculated by subtracting the value of a 26-period exponential moving average from a 12-period exponential moving average. A 9-period dotted simple moving average of the MACD (the signal line) is then plotted on top of the MACD.
MACD = EMA(CLOSE, 12)-EMA(CLOSE, 26)
SIGNAL = SMA(MACD, 9)
Where:EMA - the Exponential Moving Average;
SMA - the Simple Moving Average;
SIGNAL - the signal line of the indicator.

The InstaForex Analyst Team
GK InstaFintech © 2007-2025


