signal strength 1 of 5
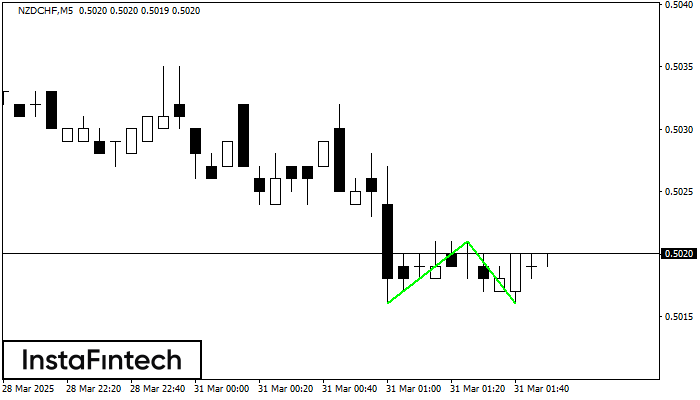
The Double Bottom pattern has been formed on NZDCHF M5; the upper boundary is 0.5021; the lower boundary is 0.5016. The width of the pattern is 5 points. In case of a break of the upper boundary 0.5021, a change in the trend can be predicted where the width of the pattern will coincide with the distance to a possible take profit level.
The M5 and M15 time frames may have more false entry points.
- All
- Double Top
- Flag
- Head and Shoulders
- Pennant
- Rectangle
- Triangle
- Triple top
- All
- #AAPL
- #AMZN
- #Bitcoin
- #EBAY
- #FB
- #GOOG
- #INTC
- #KO
- #MA
- #MCD
- #MSFT
- #NTDOY
- #PEP
- #TSLA
- #TWTR
- AUDCAD
- AUDCHF
- AUDJPY
- AUDUSD
- EURCAD
- EURCHF
- EURGBP
- EURJPY
- EURNZD
- EURRUB
- EURUSD
- GBPAUD
- GBPCHF
- GBPJPY
- GBPUSD
- GOLD
- NZDCAD
- NZDCHF
- NZDJPY
- NZDUSD
- SILVER
- USDCAD
- USDCHF
- USDJPY
- USDRUB
- All
- M5
- M15
- M30
- H1
- D1
- All
- Buy
- Sale
- All
- 1
- 2
- 3
- 4
- 5
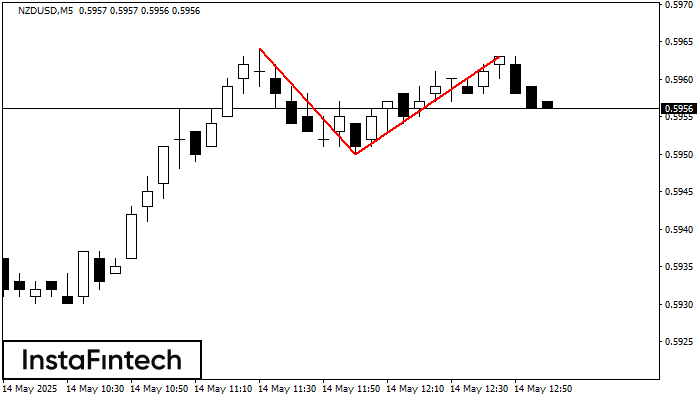
On the chart of NZDUSD M5 the Double Top reversal pattern has been formed. Characteristics: the upper boundary 0.5963; the lower boundary 0.5950; the width of the pattern 13 points
The M5 and M15 time frames may have more false entry points.
Open chart in a new window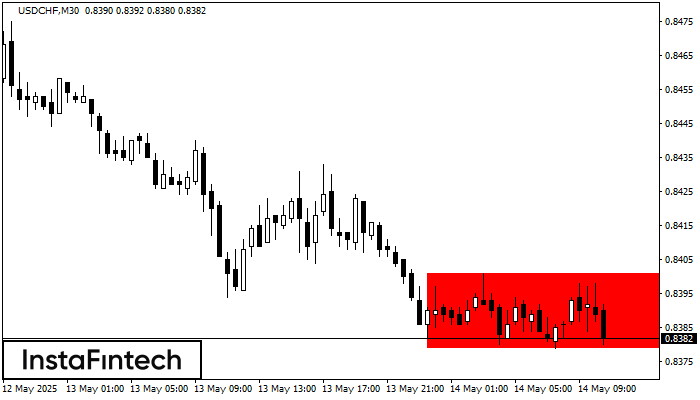
According to the chart of M30, USDCHF formed the Bearish Rectangle which is a pattern of a trend continuation. The pattern is contained within the following borders: lower border 0.8379
Open chart in a new window
According to the chart of M5, EURJPY formed the Inverse Head and Shoulder pattern. The Head’s top is set at 164.66 while the median line of the Neck is found
The M5 and M15 time frames may have more false entry points.
Open chart in a new window