signal strength 1 of 5
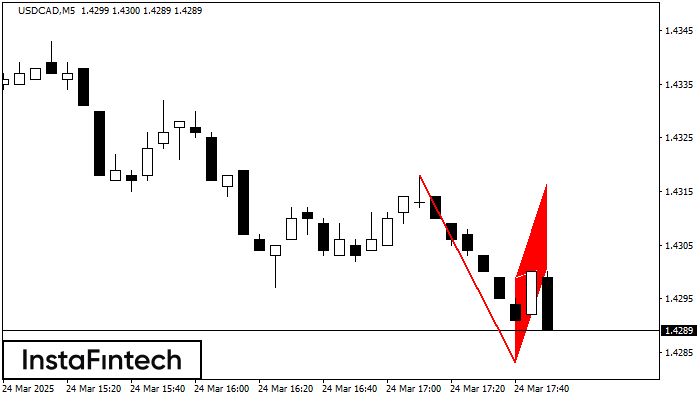
The Bearish Flag pattern has been formed on USDCAD at M5. The lower boundary of the pattern is located at 1.4283/1.4301 while the upper boundary lies at 1.4299/1.4317. The projection of the flagpole is 35 points. This formation signals that the downward trend is most likely to continue. Therefore, if the level of 1.4283 is broken, the price will move further downwards.
The M5 and M15 time frames may have more false entry points.
Lihat juga
- All
- Double Top
- Flag
- Head and Shoulders
- Pennant
- Rectangle
- Triangle
- Triple top
- All
- #AAPL
- #AMZN
- #Bitcoin
- #EBAY
- #FB
- #GOOG
- #INTC
- #KO
- #MA
- #MCD
- #MSFT
- #NTDOY
- #PEP
- #TSLA
- #TWTR
- AUDCAD
- AUDCHF
- AUDJPY
- AUDUSD
- EURCAD
- EURCHF
- EURGBP
- EURJPY
- EURNZD
- EURRUB
- EURUSD
- GBPAUD
- GBPCHF
- GBPJPY
- GBPUSD
- GOLD
- NZDCAD
- NZDCHF
- NZDJPY
- NZDUSD
- SILVER
- USDCAD
- USDCHF
- USDJPY
- USDRUB
- All
- M5
- M15
- M30
- H1
- D1
- All
- Buy
- Sale
- All
- 1
- 2
- 3
- 4
- 5
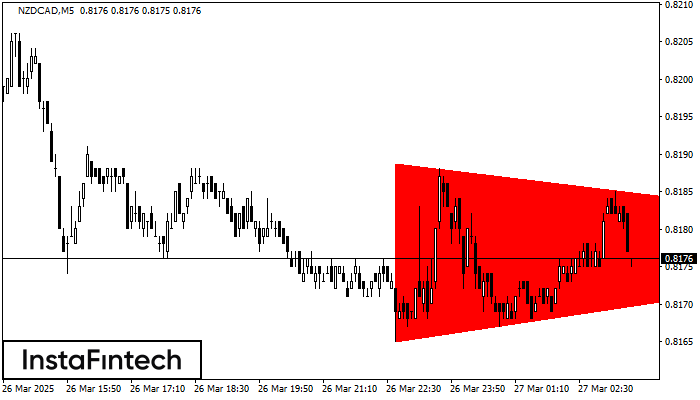
Menurut Grafik dari M5, NZDCAD dibentuk pola Segitiga Simetris Bearish. Pola ini mengisyaratkan tren penurunan lebih lanjut jika terdapat batas yang lebih rendah 0.8165 ditembus. Disini, sebuah keuntungan hipotetis akan
Rangka waktu M5 dan M15 mungkin memiliki lebih dari titik entri yang keliru.
Open chart in a new window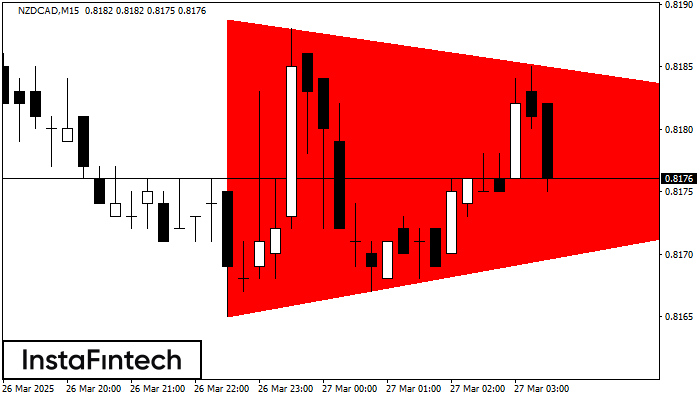
Menurut Grafik dari M15, NZDCAD dibentuk pola Segitiga Simetris Bearish. Rekomendasi Trading: Penembusan dari batas yang lebih rendah 0.8165 kemungkinan akan mendorong kelanjutan dari tren penurunan
Rangka waktu M5 dan M15 mungkin memiliki lebih dari titik entri yang keliru.
Open chart in a new window
Menurut grafik dari M5, NZDUSD membentuk pola Kepala dan Bahu Terbalik. Puncak kepala (Head) ditetapkan di 0.5723 sementara garis median leher (Neck) ditemukan di 0.5705/0.5719. Formasi pola Kepala dan Bahu
Rangka waktu M5 dan M15 mungkin memiliki lebih dari titik entri yang keliru.
Open chart in a new window