signal strength 1 of 5
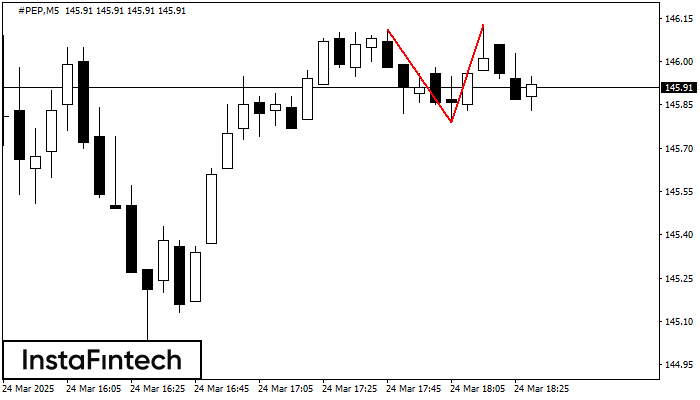
The Double Top reversal pattern has been formed on #PEP M5. Characteristics: the upper boundary 146.11; the lower boundary 145.79; the width of the pattern is 34 points. Sell trades are better to be opened below the lower boundary 145.79 with a possible movements towards the 145.64 level.
The M5 and M15 time frames may have more false entry points.
Lihat juga
- All
- Double Top
- Flag
- Head and Shoulders
- Pennant
- Rectangle
- Triangle
- Triple top
- All
- #AAPL
- #AMZN
- #Bitcoin
- #EBAY
- #FB
- #GOOG
- #INTC
- #KO
- #MA
- #MCD
- #MSFT
- #NTDOY
- #PEP
- #TSLA
- #TWTR
- AUDCAD
- AUDCHF
- AUDJPY
- AUDUSD
- EURCAD
- EURCHF
- EURGBP
- EURJPY
- EURNZD
- EURRUB
- EURUSD
- GBPAUD
- GBPCHF
- GBPJPY
- GBPUSD
- GOLD
- NZDCAD
- NZDCHF
- NZDJPY
- NZDUSD
- SILVER
- USDCAD
- USDCHF
- USDJPY
- USDRUB
- All
- M5
- M15
- M30
- H1
- D1
- All
- Buy
- Sale
- All
- 1
- 2
- 3
- 4
- 5

Pola Bawah Triple telah terbentuk pada grafik USDJPY M5. Fitur-fitur pola: garis bawah pola memiliki koordinat 150.29 dengan batas atas 150.29/150.27, proyeksi lebar adalah 19 poin. Pembentukan pola Bawah Triple
Rangka waktu M5 dan M15 mungkin memiliki lebih dari titik entri yang keliru.
Open chart in a new window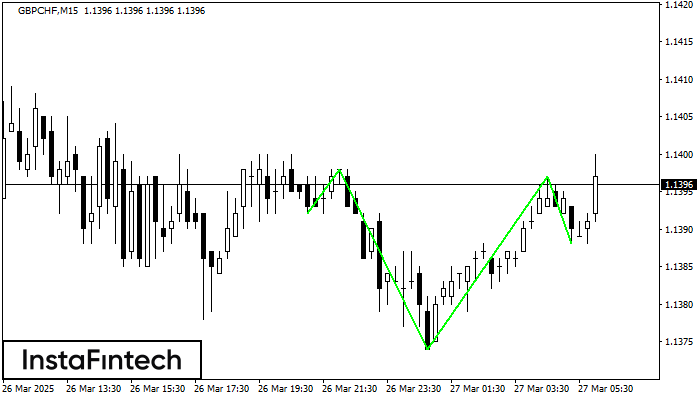
Menurut M15, GBPCHF membentuk pola teknikal – Kepala dan Bahu Terbalik. Jika garis leher (Neckline) 1.1398/1.1397 ditembus, maka instrumen ini kemungkinan akan bergerak menuju 1.1420
Rangka waktu M5 dan M15 mungkin memiliki lebih dari titik entri yang keliru.
Open chart in a new window
Menurut grafik dari M5, USDJPY terbentuk Persegi Bearish. Pola menunjukkan kelanjutan tren. Batas atas adalah 150.29, batas rendah adalah 150.10. Sinyal berarti posisi jual harus dibuka setelah menetapkan harga dibawah
Rangka waktu M5 dan M15 mungkin memiliki lebih dari titik entri yang keliru.
Open chart in a new window