signal strength 2 of 5
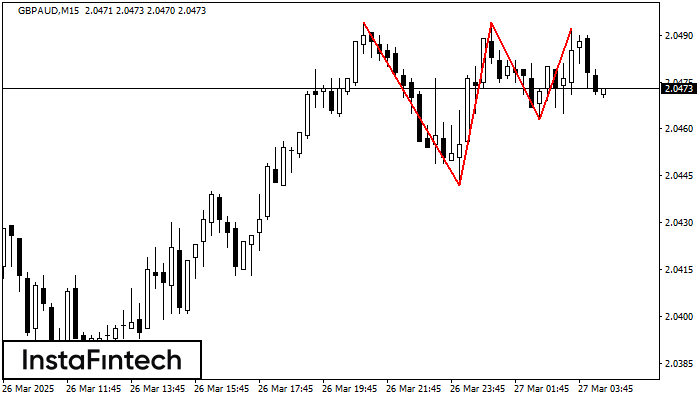
On the chart of the GBPAUD M15 trading instrument, the Triple Top pattern that signals a trend change has formed. It is possible that after formation of the third peak, the price will try to break through the resistance level 2.0442, where we advise to open a trading position for sale. Take profit is the projection of the pattern’s width, which is 52 points.
The M5 and M15 time frames may have more false entry points.
Lihat juga
- All
- Double Top
- Flag
- Head and Shoulders
- Pennant
- Rectangle
- Triangle
- Triple top
- All
- #AAPL
- #AMZN
- #Bitcoin
- #EBAY
- #FB
- #GOOG
- #INTC
- #KO
- #MA
- #MCD
- #MSFT
- #NTDOY
- #PEP
- #TSLA
- #TWTR
- AUDCAD
- AUDCHF
- AUDJPY
- AUDUSD
- EURCAD
- EURCHF
- EURGBP
- EURJPY
- EURNZD
- EURRUB
- EURUSD
- GBPAUD
- GBPCHF
- GBPJPY
- GBPUSD
- GOLD
- NZDCAD
- NZDCHF
- NZDJPY
- NZDUSD
- SILVER
- USDCAD
- USDCHF
- USDJPY
- USDRUB
- All
- M5
- M15
- M30
- H1
- D1
- All
- Buy
- Sale
- All
- 1
- 2
- 3
- 4
- 5

Menurut Grafik dari M15, NZDJPY dibentuk pola Segitiga Simetris Bearish. Deskripsi: Batas yang lebih rendah adalah 79.77/80.40 dan batas atas adalah 81.02/80.40. Lebar pola diukur dalam grafik di -125 pips
Rangka waktu M5 dan M15 mungkin memiliki lebih dari titik entri yang keliru.
Open chart in a new window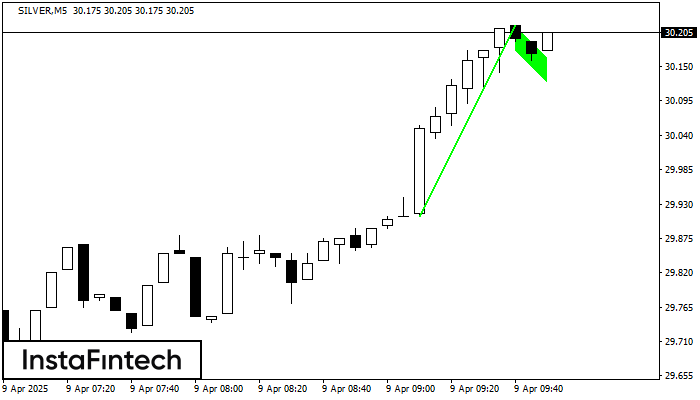
Pola Bendera Bullish telah terbentuk di grafik SILVER M5, yang memberikan sinyal tren naik akan berlanjut. Sinyal: penembusan titik puncak di 30.21 mungkin mendorong harga lebih tinggi, dan kenaikan akan
Rangka waktu M5 dan M15 mungkin memiliki lebih dari titik entri yang keliru.
Open chart in a new window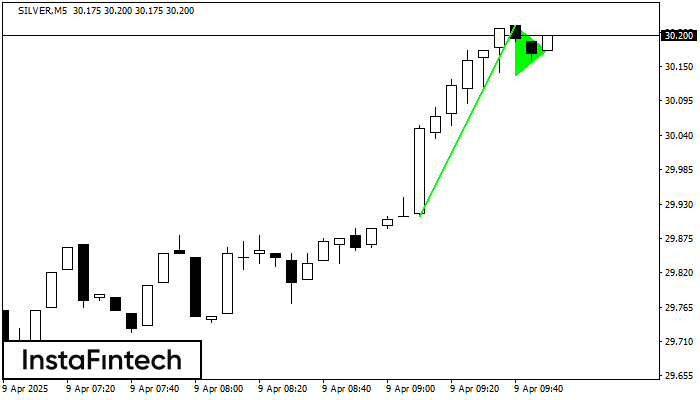
Pola grafik Panji Bullish telah terbentuk di instrumen SILVER M5. Jenis pola ini terjadi pada kategori pola kelanjutan. Dalam kasus ini, jika kuotasi dapat menembus titik tertinggi, harga diperkirakan akan
Rangka waktu M5 dan M15 mungkin memiliki lebih dari titik entri yang keliru.
Open chart in a new window