empty
16.01.2024 05:54 AM
XAU/USD H4 | Falling to support

This image is no longer relevant

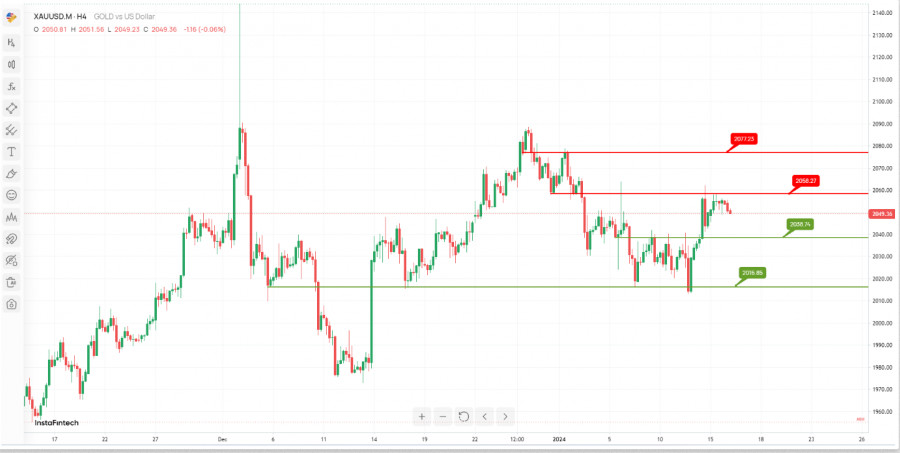
The XAU/USD (Gold/US Dollar) chart suggests a potential bearish scenario with a focus on continuing towards the support levels. Here are the key support and resistance levels:

Resistance Levels:

The 1st resistance level at 2058.27 is identified as "An Overlap resistance." This level may act as a significant barrier to further upward movement in the price of gold.

The 2nd resistance level at 2077.23 is also labeled as "An Overlap resistance." It represents another level where selling pressure could potentially emerge and limit any bullish momentum.

Support Levels:

The 1st support level at 2038.74 is marked as "Pullback support." This level could attract buying interest and serve as a potential area of price reversal or consolidation.

The 2nd support level at 2016.85 is identified as "An Overlap support." It represents another important support zone where traders might consider entering long positions.

Dean Leo,
Analytical expert of InstaForex
© 2007-2025
Select timeframe
5
min
15
min
30
min
1
hour
4
hours
1
day
1
week
Earn on cryptocurrency rate changes with InstaForex
Download MetaTrader 4 and open your first trade
  • Grand Choice
    Contest by
    InstaForex
    InstaForex always strives to help you
    fulfill your biggest dreams.
    JOIN CONTEST

Recommended Stories

Forecast for EUR/USD on May 15, 2025

On Wednesday, the EUR/USD pair rose toward the resistance zone of 1.1265–1.1282, rebounded from it, and reversed in favor of the U.S. dollar, which managed to gain about 80 points

Samir Klishi 11:00 2025-05-15 UTC+2

Forecast for GBP/USD on May 15, 2025

On the hourly chart, the GBP/USD pair climbed to the resistance zone of 1.3344–1.3357 on Wednesday, rebounded from it, and began a downward move toward the 100.0% Fibonacci level

Samir Klishi 10:56 2025-05-15 UTC+2

Technical Analysis of Daily Price Movement of USD/IDR Exotic Currency Pairs, Thursday May 15, 2025

From what is seen on the daily chart, the Exotic USD/IDR currency pair appears to have a Bearish 123 pattern followed by the appearance of 2 Bearish Ross Hook (RH)

Arief Makmur 06:46 2025-05-15 UTC+2

Technical Analysis of Intraday Price Movement of Nasdaq 100 Index, Thursday May 15, 2025

If we look at the 4-hour chart of the Nasdaq 100 index moving above the WMA (21) which has a slope that is going upwards, indicating that currently Buyers

Arief Makmur 06:46 2025-05-15 UTC+2

EUR/USD Forecast for May 15, 2025

On Wednesday, the euro managed to rise to the target level of 1.1266 (the lows from April 15 and May 1), but in the absence of external support (S&P

Laurie Bailey 04:40 2025-05-15 UTC+2

GBP/USD Forecast for May 15, 2025

The British pound struggles to break above the 1.3311 resistance level with a daily candle close. In the current context, this level aligns with the zero (neutral) line

Laurie Bailey 04:40 2025-05-15 UTC+2

USD/JPY Forecast for May 15, 2025

By the end of yesterday's trading session, the USD/JPY pair declined by 73 pips, testing the MACD indicator line with a lower shadow. It's clear that an attempt to consolidate

Laurie Bailey 04:40 2025-05-15 UTC+2

Trading Signals for EUR/USD for May 14-19, 2025: sell below 1.1230 (200 EMA - 21 SMA)

The euro is expected to continue its fall in the coming hours. Therefore, we should expect a close below 1.1186 on the H4 chart. Then, the price could slide

Dimitrios Zappas 18:06 2025-05-14 UTC+2

Trading Signals for GOLD for May 14-19, 2025: buy above $3,175 (200 EMA - rebound)

Gold left a gap around 3,325. It is likely to be filled in the coming days. For this, we should wait for gold to consolidate above 3,230, then the outlook

Dimitrios Zappas 18:05 2025-05-14 UTC+2

WTI - West Texas Intermediate. Analysis and Forecast

Prices for U.S. crude oil West Texas Intermediate (WTI) are consolidating near a one-month high, pausing a four-day winning streak, although the intraday pullback lacks bearish conviction. WTI prices

Irina Yanina 17:55 2025-05-14 UTC+2
Can't speak right now?
Ask your question in the chat.
Widget callback
 

Dear visitor,

Your IP address shows that you are currently located in the USA. If you are a resident of the United States, you are prohibited from using the services of InstaFintech Group including online trading, online transfers, deposit/withdrawal of funds, etc.

If you think you are seeing this message by mistake and your location is not the US, kindly proceed to the website. Otherwise, you must leave the website in order to comply with government restrictions.

Why does your IP address show your location as the USA?

  • - you are using a VPN provided by a hosting company based in the United States;
  • - your IP does not have proper WHOIS records;
  • - an error occurred in the WHOIS geolocation database.

Please confirm whether you are a US resident or not by clicking the relevant button below. If you choose the wrong option, being a US resident, you will not be able to open an account with InstaForex anyway.

We are sorry for any inconvenience caused by this message.