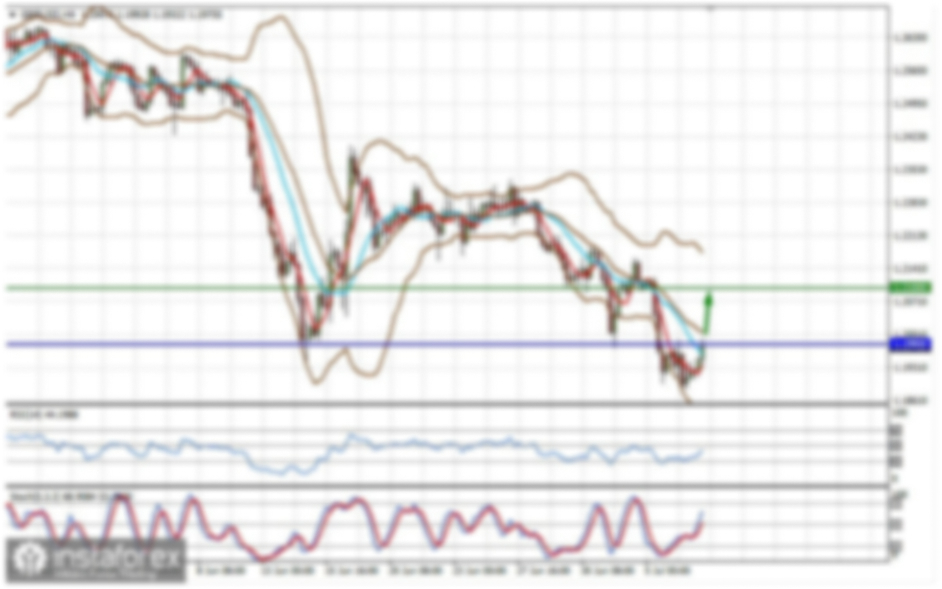
GBP/USD
Analysis:
The trend direction of the main pair of the British pound since July of last year is defined by a bearish wave. Since December, quotes have formed a corrective shifting plane that needs to be completed. The calculated support coincides with the weekly scale's strong potential reversal level.
Forecast:
In the next few days, the British pound is expected to continue its overall sideways movement. In the support zone, conditions for a reversal are likely to form. A change in direction can be anticipated by the end of the week.
Potential Reversal Zones:
Resistance:
Support:
Recommendations:
Selling: No conditions for transactions in the coming week.
Buying: Premature until confirmed reversal signals appear in your trading systems in the calculated support area.
AUD/USD
Analysis:
The unfinished bearish wave structure of the main pair of the Australian dollar dates back to July of last year. The wave structure began in the final part (C) last month. The price drifted sideways within the last two weeks, forming an intermediate correction. The descending segment that started last Friday has a reversal potential.
Forecast:
A price decrease and completion in the calculated support area can be expected during the upcoming week. With a high probability, the price of the pair will then drift. A change in direction and a resumption of price growth can be expected closer to the weekend.
Potential Reversal Zones:
Resistance:
Support:
Recommendations:
Selling: Possible with fractional lots within intraday until the first reversal signals.
Buying: Only becomes relevant after the appearance of corresponding signals in your trading systems in the support zone.
USD/CHF
Analysis:
Since November 2022, the quotes of the Swiss franc major formed a downward trend. The unfinished wave starts counting from the end of last year and is directed against the main course. The high wave level of this movement allows for the expectation of at least a correction of the entire previous trend. The middle part (C) has formed in the wave structure in the last few weeks. The ascending segment from February 2nd has a reversal potential.
Forecast:
A change in the overall sentiment of price movement is expected next week. After a possible decrease to the support zone, a resumption of the ascending vector can be expected, with the completion of the rise in the calculated resistance area. The coincidence of activity in time is likely with the release of important news blocks.
Potential Reversal Zones:
Resistance:
Support:
Recommendations:
Selling: Permissible with fractional lots during individual trading sessions.
Buying: Become safe after confirmed signals appear in the support area on your used trading systems.
EUR/JPY
Analysis:
The euro/Japanese yen pair chart analysis indicates an unfinished bullish movement since December 7th of last year. Within the last two weeks, a bearish correction (B) has been developing. At the time of the analysis, the wave structure looks fully formed. The ascending segment that started last week has a reversal potential.
Forecast:
Throughout the upcoming week, the continuation of the upward price movement of the cross is expected. A short-term rollback is not ruled out in the next few days, not below the support zone. A reversal and increased quotes can be expected no further than the calculated resistance zone. After that, with a high probability, the price will change direction and return to current values.
Potential Reversal Zones:
Resistance:
Support:
Recommendations:
Buying: Possible from the support zone, within individual sessions. It is advisable to reduce the trading lot.
Selling: Irrelevant until confirmed signals appear in the calculated resistance area.
AUD/JPY
Analysis:
The direction of the short-term trend of the pair of the Australian dollar against the Japanese yen is set by the bearish plane that started in June of last year. The wave structure does not indicate completeness. Quotes are squeezed in a narrow price range between strong opposing zones of higher timeframes.
Forecast:
At the beginning of the upcoming week, the most expected scenario is a gradual decrease in the price to the support boundaries. In the second half, the chances of increased volatility and a resumption of the upward trend increase. A breakthrough above the calculated resistance within the upcoming week is unlikely.
Potential Reversal Zones:
Resistance:
Support:
Recommendations:
Buying: Possible from the support zone, within individual sessions. It is advisable to reduce the trading lot.
Selling: Irrelevant until confirmed signals appear in the calculated resistance area.
US dollar index
Brief Analysis:
The movement direction of the US Dollar Index is defined by the algorithm of the ascending wave from the end of December of last year. In the second half of the past month, quotes spent time in a sideways drift, forming an unfinished stretched correction at the time of the analysis. The ascending segment at the end of last week has a high wave level. Quotes are approaching the lower boundary of a strong potential reversal zone.
Week Forecast:
At the beginning of the upcoming week, the completion of the upward retracement of the dollar index can be expected. A sideways drift and a reversal formation are expected in the calculated resistance area. The start of a decline is likely closer to the weekend.
Potential Reversal Zones:
Resistance:
Support:
Recommendations:
With fractional lots, sales of USD counterparts in major pairs may be possible in the coming days. Buys of national currency in majors become relevant after the formation of confirmed reversal signals in the resistance area.
Explanations: In simplified wave analysis (SWA), all waves consist of 3 parts (A-B-C). On each timeframe (TF), the analysis is performed on the last unfinished wave. Dashed lines indicate expected movements.
Note: The wave algorithm does not consider the duration of instrument movements over time!