signal strength 1 of 5
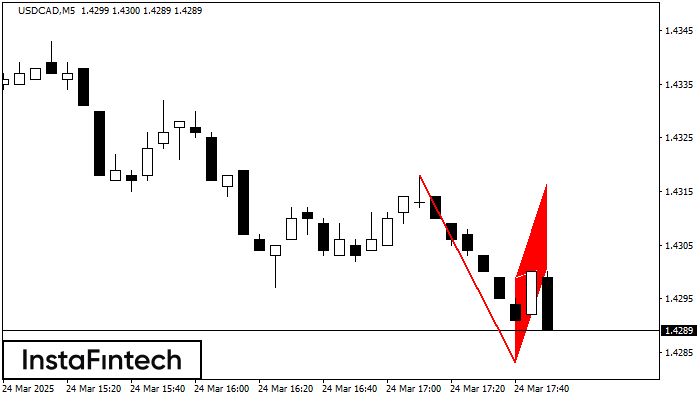
The Bearish Flag pattern has been formed on USDCAD at M5. The lower boundary of the pattern is located at 1.4283/1.4301 while the upper boundary lies at 1.4299/1.4317. The projection of the flagpole is 35 points. This formation signals that the downward trend is most likely to continue. Therefore, if the level of 1.4283 is broken, the price will move further downwards.
The M5 and M15 time frames may have more false entry points.
Juga lihat
- All
- Double Top
- Flag
- Head and Shoulders
- Pennant
- Rectangle
- Triangle
- Triple top
- All
- #AAPL
- #AMZN
- #Bitcoin
- #EBAY
- #FB
- #GOOG
- #INTC
- #KO
- #MA
- #MCD
- #MSFT
- #NTDOY
- #PEP
- #TSLA
- #TWTR
- AUDCAD
- AUDCHF
- AUDJPY
- AUDUSD
- EURCAD
- EURCHF
- EURGBP
- EURJPY
- EURNZD
- EURRUB
- EURUSD
- GBPAUD
- GBPCHF
- GBPJPY
- GBPUSD
- GOLD
- NZDCAD
- NZDCHF
- NZDJPY
- NZDUSD
- SILVER
- USDCAD
- USDCHF
- USDJPY
- USDRUB
- All
- M5
- M15
- M30
- H1
- D1
- All
- Buy
- Sale
- All
- 1
- 2
- 3
- 4
- 5

Corak Triple Bottom telah dibentuk pada EURGBP M5. Ia mempunyai ciri-ciri berikut: tahap rintangan 0.8515/0.8514; tahap sokongan 0.8509/0.8509; lebar corak adalah 6 mata. Dalam situasi penembusan paras rintangan 0.8515, harga
Carta masa M5 dan M15 mungkin mempunyai lebih banyak titik kemasukan palsu.
Open chart in a new window
Corak pembalikan Double Top telah dibentuk pada USDJPY M5. Ciri-ciri: sempadan atas %P0.000000; sempadan bawah 145.09; sempadan bawah 144.90; lebar corak adalah 18 mata. Dagangan menjual adalah lebih baik untuk
Carta masa M5 dan M15 mungkin mempunyai lebih banyak titik kemasukan palsu.
Open chart in a new window
Corak Triple Bottom telah dibentuk pada EURGBP M5. Ia mempunyai ciri-ciri berikut: tahap rintangan 0.8515/0.8514; tahap sokongan 0.8509/0.8509; lebar corak adalah 6 mata. Dalam situasi penembusan paras rintangan 0.8515, harga
Carta masa M5 dan M15 mungkin mempunyai lebih banyak titik kemasukan palsu.
Open chart in a new window