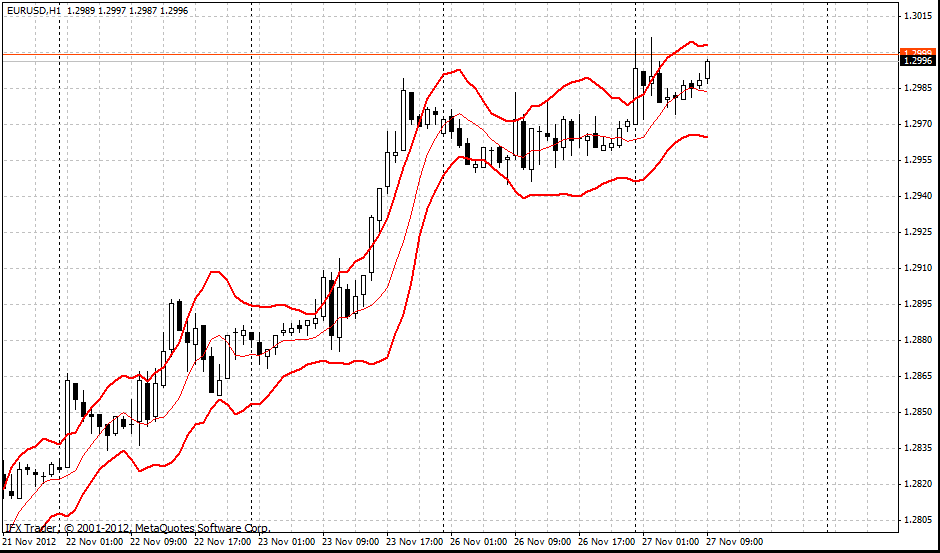
The trend indicator was developed by a technical analyst Manning Stoller in the early 1980s. STARC bands are used in classical trend trading where a range breakout is taken into account.
Formula
Median band = SMA(n) = SMA(5)
Upper band = SMA(n) + (ATR(m)*K) = SMA(5) + (ATR(15)*1,33)
Lower band = SMA(n) - (ATR(m)*K) = SMA(5) - (ATR(15)*1,33)
Trading use
STARC bands (Stoller average range channels) are three bands forming a channel around simple moving average.
The indicator is similar to Bollinger Bands; STARC bands are narrowing on the flat markets and widening on the volatile markets. However, STARC bands do not measure the highness and lowness of the price and do not take into account standard deviation as Bollinger Bands. It is calculated by means of Average True Range (ATR) providing more detailed information on market volatility. Using STARC bands period 10 is an optimum parameter for ATR.
This indicator has two functions. First, it is used as a signal which recommends opening buy or sell deals when the price crosses the boarders of STARC bands. In this case one should wait till the price consolidates above or under the STARC bands and stop loss should be placed after the median line.
Second, STARC indicator can be used as an indicator whether the price is oversold or overbought. In order to do it index K should be moved from 3 to 1.33. In this case test of the price of STARC bands means the price has reached extreme values; the probability of price swing is very high. This signal should be accompanied by signals of oscillators pointing out oversold/overbought areas (for example, RSI indicator).

Parameters of InstaForex STARC bands indicator
BandsPeriod = 6
ATR = 10
K = 1.33
BandsShift = 2


