signal strength 1 of 5
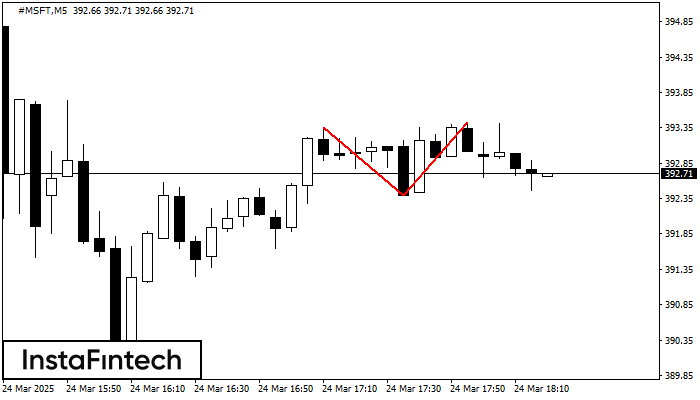
The Double Top pattern has been formed on #MSFT M5. It signals that the trend has been changed from upwards to downwards. Probably, if the base of the pattern 392.40 is broken, the downward movement will continue.
The M5 and M15 time frames may have more false entry points.
یہ بھی دیکھیں
- All
- Double Top
- Flag
- Head and Shoulders
- Pennant
- Rectangle
- Triangle
- Triple top
- All
- #AAPL
- #AMZN
- #Bitcoin
- #EBAY
- #FB
- #GOOG
- #INTC
- #KO
- #MA
- #MCD
- #MSFT
- #NTDOY
- #PEP
- #TSLA
- #TWTR
- AUDCAD
- AUDCHF
- AUDJPY
- AUDUSD
- EURCAD
- EURCHF
- EURGBP
- EURJPY
- EURNZD
- EURRUB
- EURUSD
- GBPAUD
- GBPCHF
- GBPJPY
- GBPUSD
- GOLD
- NZDCAD
- NZDCHF
- NZDJPY
- NZDUSD
- SILVER
- USDCAD
- USDCHF
- USDJPY
- USDRUB
- All
- M5
- M15
- M30
- H1
- D1
- All
- Buy
- Sale
- All
- 1
- 2
- 3
- 4
- 5
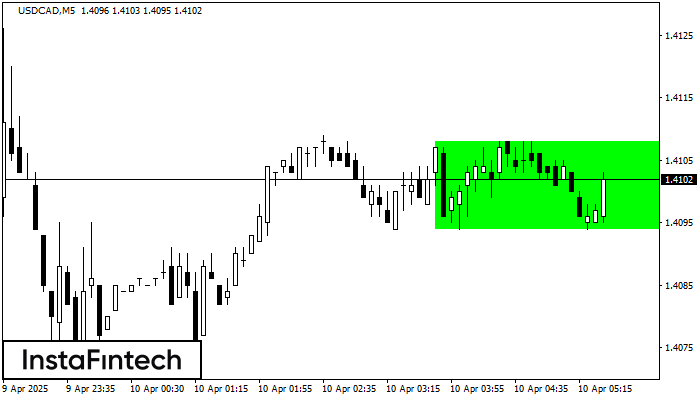
According to the chart of M5, USDCAD formed the Bullish Rectangle. The pattern indicates a trend continuation. The upper border is 1.4108, the lower border is 1.4094. The signal means
The M5 and M15 time frames may have more false entry points.
Open chart in a new window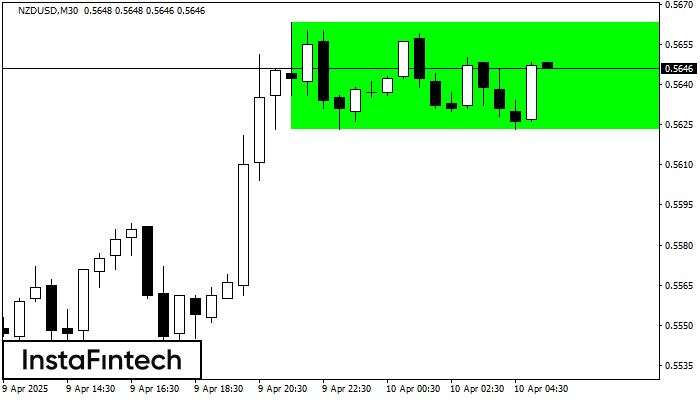
According to the chart of M30, NZDUSD formed the Bullish Rectangle. The pattern indicates a trend continuation. The upper border is 0.5663, the lower border is 0.5623. The signal means
Open chart in a new window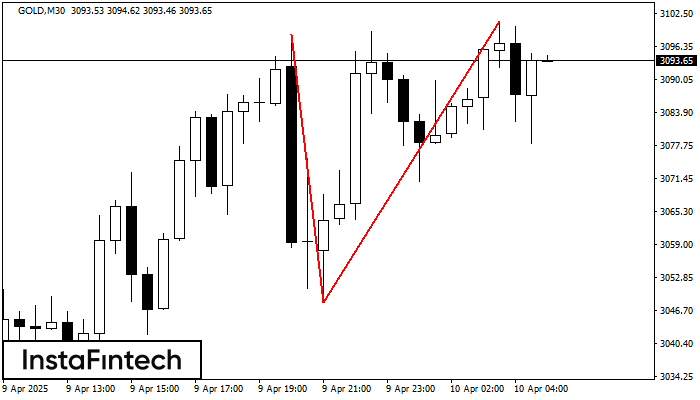
On the chart of GOLD M30 the Double Top reversal pattern has been formed. Characteristics: the upper boundary 3100.96; the lower boundary 3048.18; the width of the pattern 5278 points
Open chart in a new window