signal strength 1 of 5
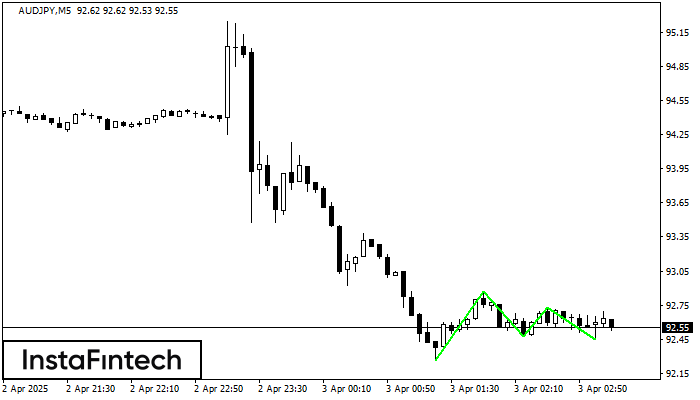
The Triple Bottom pattern has been formed on AUDJPY M5. It has the following characteristics: resistance level 92.87/92.73; support level 92.26/92.45; the width is 61 points. In the event of a breakdown of the resistance level of 92.87, the price is likely to continue an upward movement at least to 92.62.
The M5 and M15 time frames may have more false entry points.
Veja também
- All
- Double Top
- Flag
- Head and Shoulders
- Pennant
- Rectangle
- Triangle
- Triple top
- All
- #AAPL
- #AMZN
- #Bitcoin
- #EBAY
- #FB
- #GOOG
- #INTC
- #KO
- #MA
- #MCD
- #MSFT
- #NTDOY
- #PEP
- #TSLA
- #TWTR
- AUDCAD
- AUDCHF
- AUDJPY
- AUDUSD
- EURCAD
- EURCHF
- EURGBP
- EURJPY
- EURNZD
- EURRUB
- EURUSD
- GBPAUD
- GBPCHF
- GBPJPY
- GBPUSD
- GOLD
- NZDCAD
- NZDCHF
- NZDJPY
- NZDUSD
- SILVER
- USDCAD
- USDCHF
- USDJPY
- USDRUB
- All
- M5
- M15
- M30
- H1
- D1
- All
- Buy
- Sale
- All
- 1
- 2
- 3
- 4
- 5
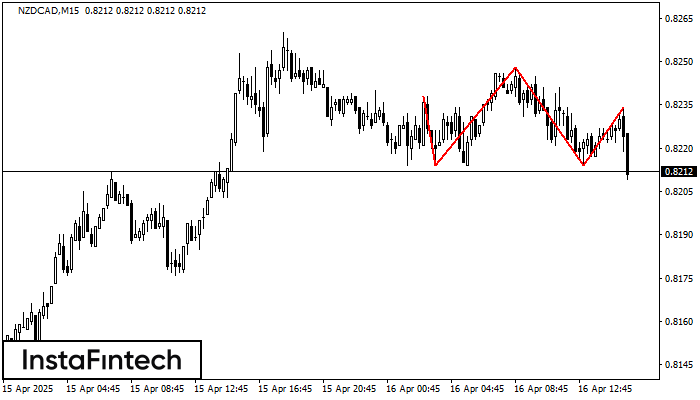
Os NZDCAD M15 formaram o padrão Cabeça & Ombros com as seguintes características: O topo da cabeça está em 0.8248, a linha do pescoço e o ângulo para cima estão
Os intervalos M5 e M15 podem ter mais pontos de entrada falsos.
Open chart in a new window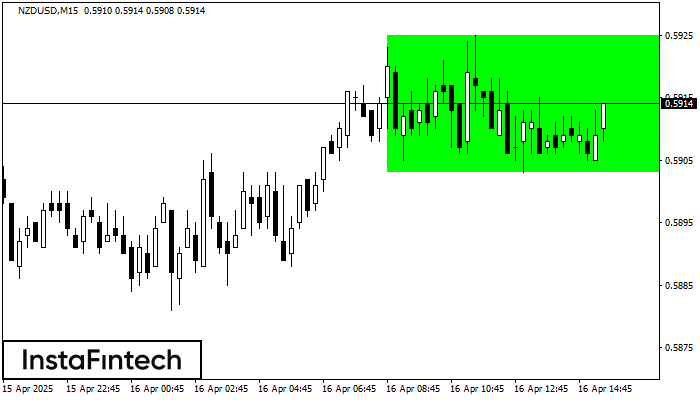
De acordo com o gráfico de M15, NZDUSD formou o Retângulo de alta que é um padrão de uma continuação da tendência. O padrão está dentro dos seguintes limites
Os intervalos M5 e M15 podem ter mais pontos de entrada falsos.
Open chart in a new window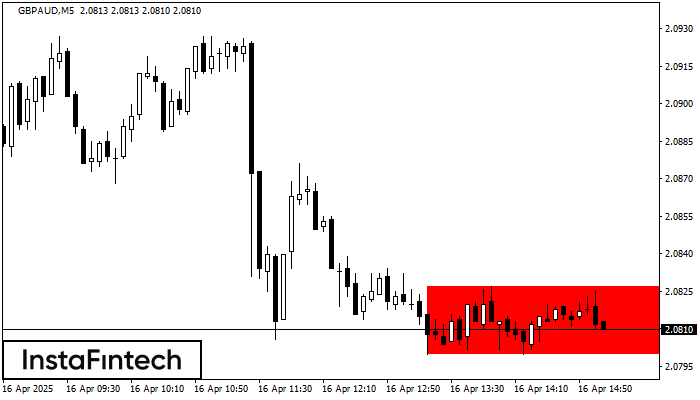
De acordo com o gráfico de M5, GBPAUD formou Retângulo de baixa. Este tipo de padrão indica uma continuação da tendência. Ele consiste em dois níveis: resistência 2.0827 – 0.0000
Os intervalos M5 e M15 podem ter mais pontos de entrada falsos.
Open chart in a new window