signal strength 1 of 5
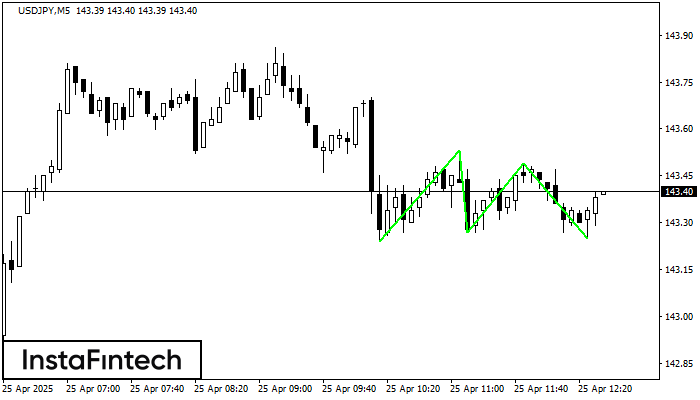
The Triple Bottom pattern has been formed on USDJPY M5. It has the following characteristics: resistance level 143.53/143.49; support level 143.24/143.25; the width is 29 points. In the event of a breakdown of the resistance level of 143.53, the price is likely to continue an upward movement at least to 143.42.
The M5 and M15 time frames may have more false entry points.
Veja também
- All
- Double Top
- Flag
- Head and Shoulders
- Pennant
- Rectangle
- Triangle
- Triple top
- All
- #AAPL
- #AMZN
- #Bitcoin
- #EBAY
- #FB
- #GOOG
- #INTC
- #KO
- #MA
- #MCD
- #MSFT
- #NTDOY
- #PEP
- #TSLA
- #TWTR
- AUDCAD
- AUDCHF
- AUDJPY
- AUDUSD
- EURCAD
- EURCHF
- EURGBP
- EURJPY
- EURNZD
- EURRUB
- EURUSD
- GBPAUD
- GBPCHF
- GBPJPY
- GBPUSD
- GOLD
- NZDCAD
- NZDCHF
- NZDJPY
- NZDUSD
- SILVER
- USDCAD
- USDCHF
- USDJPY
- USDRUB
- All
- M5
- M15
- M30
- H1
- D1
- All
- Buy
- Sale
- All
- 1
- 2
- 3
- 4
- 5
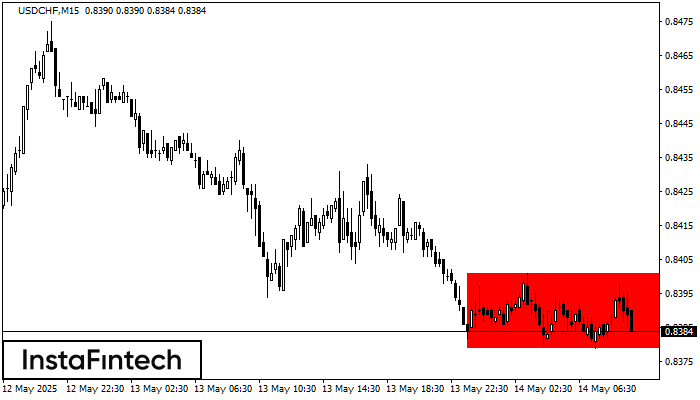
According to the chart of M15, USDCHF formed the Bearish Rectangle. The pattern indicates a trend continuation. The upper border is 0.8401, the lower border is 0.8379. The signal means
The M5 and M15 time frames may have more false entry points.
Open chart in a new window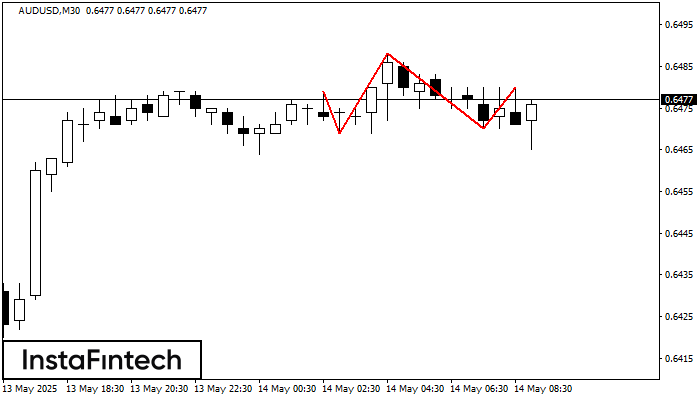
According to the chart of M30, AUDUSD formed the Head and Shoulders pattern. The Head’s top is set at 0.6488 while the median line of the Neck is found
Open chart in a new window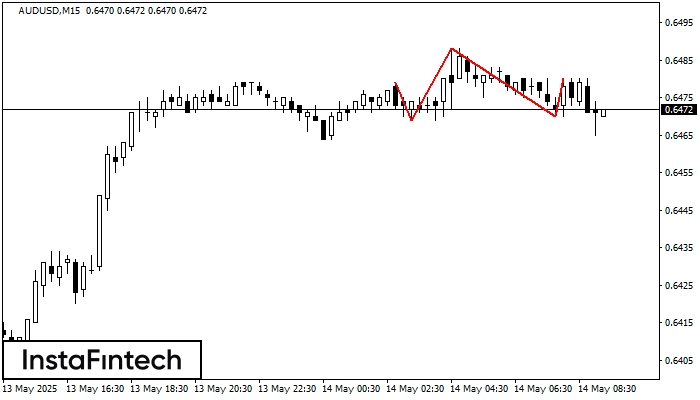
The technical pattern called Head and Shoulders has appeared on the chart of AUDUSD M15. There are weighty reasons to suggest that the price will surpass the Neckline 0.6469/0.6470 after
The M5 and M15 time frames may have more false entry points.
Open chart in a new window