empty
 
 
11.11.2024 03:17 AM
Trading Recommendations and Analysis for GBP/USD on November 11; The Pound Remains in a Broad Horizontal Channel

GBP/USD 5-Minute Analysis

This image is no longer relevant

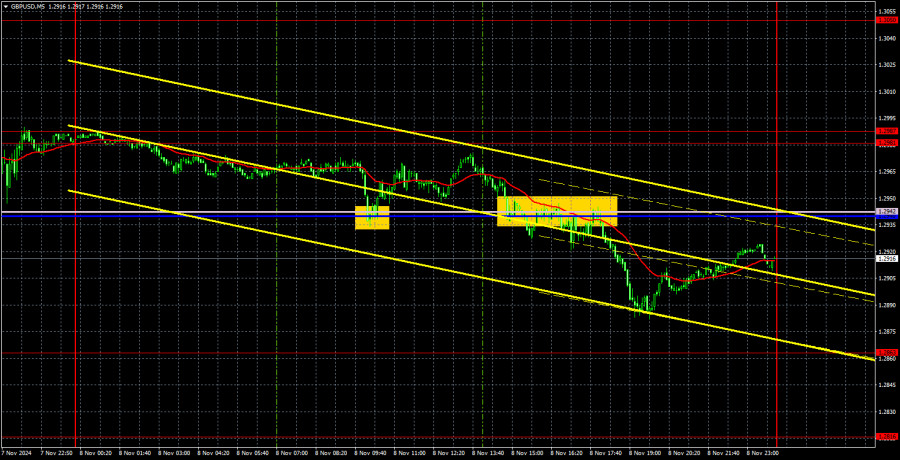
On Friday, the GBP/USD currency pair demonstrated notable declines. However, unlike EUR/USD, it remains within a horizontal channel between 1.2863 and 1.3050. Although this channel is quite broad, it remains a range-bound market, meaning the price may continue fluctuating within this range in the coming week. The channel size allows for significant price movements without breaking out, making it challenging for the pair to escape.

Despite being "stuck in the mud," we anticipate further declines for the British pound. Historically, the pound tends to fall more slowly than the euro, adjusted for each currency's volatility. Pound volatility is traditionally higher, so the euro's decline appears more significant even when both currencies drop by 100 pips. The Bank of England continues to hold off on aggressive rate cuts, awaiting inflation growth. However, we believe this approach will not save the pound. While it may slow its decline and provide pauses (as seen now), the BoE is likely to eventually adopt an aggressive easing stance and reduce rates to neutral levels.

In contrast, the U.S. Federal Reserve faces a different scenario. With Donald Trump's presidency, U.S. policy may turn inflationary, forcing the Fed to lower rates less aggressively than markets expect, as they still anticipate maximum easing.

On Friday, the pound generated two signals: initially rebounding from the Senkou Span B and Kijun-sen lines and then breaking through them. The price increased by 25 pips in the first and 40 pips in the second. Losses were physically impossible in both cases, with profits dependent on manually closing positions.

COT Report

This image is no longer relevant

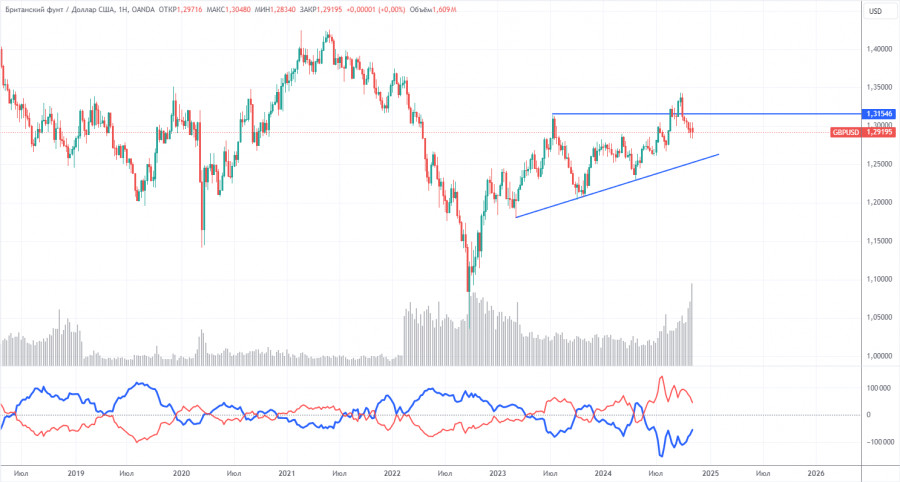
The latest Commitments of Traders (COT) report for the British pound highlights fluctuating sentiment among commercial traders in recent years. The red and blue lines, representing the net positions of commercial and non-commercial traders, frequently intersect and remain near zero. The most recent downtrend coincided with the red line moving below the zero mark. The red line is above zero, and the price has breached the critical level of 1.3154.

The latest COT report shows that the non-commercial group closed 11,900 BUY contracts and opened 9,400 SELL contracts, reducing their net position by 21,300. Despite this, the market remains hesitant to sell the pound in the medium term.

The fundamental backdrop continues not to justify long-term pound purchases. Meanwhile, the currency has a realistic chance of resuming its global downtrend. However, the weekly time frame shows an ascending trendline, so expecting long-term pound depreciation is premature until this line is breached. The pound has been rising against most expectations in the medium term.

GBP/USD 1-Hour Analysis

This image is no longer relevant

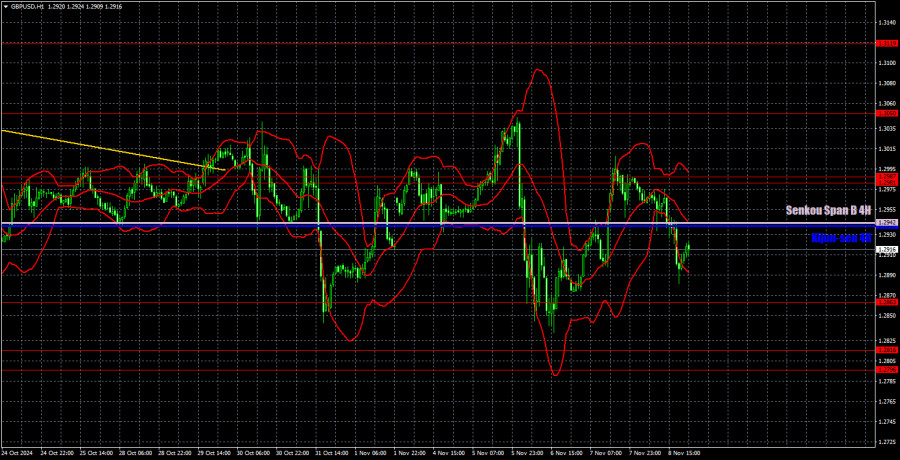
In the hourly time frame, GBP/USD maintains its bearish bias. The previous uptrend has been invalidated, so further significant and prolonged declines in the British pound are expected. While the first correction wave has ended, a second wave has begun. Regardless, there is no reason to expect medium-term dollar weakness. The pair remains in a horizontal channel, making a breakout challenging.

For November 11, the following key levels are highlighted: 1.2796-1.2816, 1.2863, 1.2981-1.2987, 1.3050, 1.3119, 1.3175, 1.3222, 1.3273, 1.3367, 1.3439. The Senkou Span B (1.2942) and Kijun-sen (1.2939) lines may also serve as signal sources. Set a Stop Loss to breakeven once the price moves 20 pips in the intended direction. Remember that Ichimoku indicator lines may shift throughout the day, which should be considered when identifying trading signals.

No significant events are scheduled in the UK or U.S. on Monday, making it unlikely for the pound to break out of its current horizontal channel. Volatility is expected to remain low.

Chart Explanations:

Support and resistance levels: thick red lines around which movement may end. They are not sources of trading signals.

Kijun-sen and Senkou Span B lines: Ichimoku indicator lines transferred from the 4-hour to the 1-hour timeframe. These are strong lines.

Extreme levels: thin red lines where the price previously rebounded. They are sources of trading signals.

Yellow lines: Trend lines, trend channels, and other technical patterns.

Indicator 1 on COT charts: The net position size for each category of traders.

Gana con los cambios en el valor de las criptomonedas con InstaForex.
Descarga MetaTrader 4 y abre tu primera operación.
  • Grand Choice
    Contest by
    InstaForex
    InstaForex always strives to help you
    fulfill your biggest dreams.
    UNIRSE AL CONCURSO
  • Depósito al azar
    ¡Haga un depósito en su cuenta de $3,000 y obtenga $10000 más!
    ¡En Enero, sorteamos $10000 dentro de la campaña Depósito afortunado!
    Obtenga la oportunidad de ganar depositando $3,000 en una cuenta de operaciones. Tras haber cumplido esta condición, se convertirá en un participante de la campaña.
    UNIRSE AL CONCURSO
  • Opere de forma inteligente, gane un dispositivo
    Recargue su cuenta con al menos $500, regístrese en el concurso y tenga la oportunidad de ganar dispositivos móviles.
    UNIRSE AL CONCURSO
  • 100% de bonificación
    Su oportunidad única de obtener un bono del 100 % en su depósito
    OBTENER BONO
  • 55% de bonificación
    Solicite un bono del 55% en cada depósito
    OBTENER BONO
  • 30% de bonificación
    Reciba un bono del 30% cada vez que recargue su cuenta
    OBTENER BONO

Recommended Stories

¿No puede hablar ahora mismo?
Ingrese su pregunta en el chat.
Widget callback