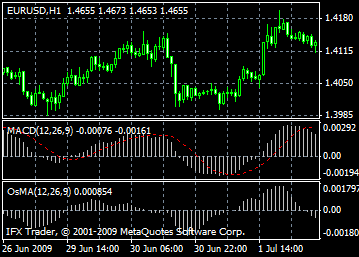
Moving Average Convergence/Divergence (MACD) เป็น indicator ซึ่งเคลื่อนที่ตามเทรนด์ โดยบอกถึงความสัมพันธ์ระหว่างค่าเฉลี่ยเคลื่อนที่ของราคาสองค่า
Moving Average Convergence/Divergence ส้รางขึ้นจากความแตกต่างระหว่างค่าเฉลี่ยเคลื่อนที่สำหรับ 26-period และ 12-period เพื่อการบ่งชี้จังหวะที่ได้เปรียบที่สุด, จึงมีการเพิ่มเส้นบอกสัญญาณ (ค่าเฉลี่ยเคลื่อนที่ 9-period) ใน MACD
MACD เหมาะสำหรับการใช้ในตลาดที่มีการแกว่งตัวสูง Moving Average Convergence/Divergence มักส่งสัญญาณหากเกิดการตัดกัน (crossing) หรือ การลู่ออกจากกัน (divergence) ในตลาดที่มีภาวะ overbought/oversold
การตัดกัน (crossing)
กฎพื้นฐานในการเทรด MACD อยู่บนพื้นฐานของการตัดกันของ indicator กับเส้นบอกสัญญาณ เมื่อ MACD ลงต่ำกว่าเส้นบอกสัญญาณ เป็นจังหวะในการขาย เมื่อ MACD ขึ้นสูงกว่าเส้นบอกสัญญาณ เป็นจังหวะในการซื้อ ซื้อหรือขายเมื่อ MACD อยู่เหนือหรืออยู่ต่ำกว่าศูนย์
ภาวะ Overbought/oversold
การลู่เข้า/การลู่ออกเฉลี่ย (Average Convergence/Divergence) เป้นประโยชน์ในการบ่งชี้ภาวะ overbought/oversold เมื่อ MACD ปรับเพิ่มขึ้น, นั่นหมายความว่าราคานั้นแพง (overvalued) และกำลังจะกลับสู่ระดับที่เป็นจริงในไม่ช้า
การลู่ออกจากกัน (divergence)
การบ่งบอกว่าเทรนด์ในปัจจุบันกำลังจะสิ้นสุดลงเกิดขึ้นเมื่อ MACD เบนออกจากราคา ภาวะ Bullish divergence เกิดขึ้นเมื่อราคาทำจุดสูงสุดใหม่และในขณะเดียวกัน Moving Average Convergence/Divergence ไม่สามารถทำจุดสูงสุดใหม่ได้ ภาวะ Bearish convergence เกิดขึ้นเมื่อราคาทำจุดต่ำสุดใหม่และ MACD ไม่สามารถทำจุดต่ำสุดใหม่ได้ Divergence ทั้งสองประเภทมีนัยสำคัญหากเกิดขึ้นในบริเวณ overbought/oversold
ค่าเฉลี่ยเคลื่อนที่ของ Oscillator (OsMA) – หมายถึง ความแตกต่างระหว่าง oscillator และการปรับเรียบของ oscillator (oscillator smoothing) ในกรณีนี้, เส้น MACD หลักใช้เป็น oscillator และ เส้นบอกสัญญาณใช้เป็นการปรับเรียบของ oscillator (oscillator smoothing)

การคำนวณ MACD
MACD คำนวณโดยการลบ 26-period exponential moving average ออกจาก 12-period exponential moving average จากนั้น, plot เส้นไข่ปลาสำหรับ 9-period simple moving average ของ MACD (เส้นบอกสัญญาณ) ไว้เหนือเส้น MACD
MACD = EMA(CLOSE, 12)-EMA(CLOSE, 26)
SIGNAL = SMA(MACD, 9)
Where:EMA - the Exponential Moving Average;
SMA - the Simple Moving Average;
SIGNAL - เส้นบอกสัญญาณของ indicator

The InstaForex Analyst Team
GK InstaFintech © 2007-2025


