

signal strength 1 of 5
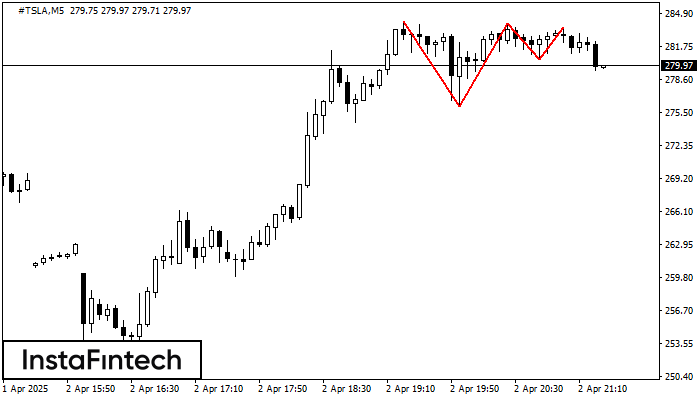
The Triple Top pattern has formed on the chart of the #TSLA M5 trading instrument. It is a reversal pattern featuring the following characteristics: resistance level 56, support level -444, and pattern’s width 805. Forecast If the price breaks through the support level 276.07, it is likely to move further down to 283.77.
The M5 and M15 time frames may have more false entry points.
ดูเพิ่มเติม
- All
- Double Top
- Flag
- Head and Shoulders
- Pennant
- Rectangle
- Triangle
- Triple top
- All
- #AAPL
- #AMZN
- #Bitcoin
- #EBAY
- #FB
- #GOOG
- #INTC
- #KO
- #MA
- #MCD
- #MSFT
- #NTDOY
- #PEP
- #TSLA
- #TWTR
- AUDCAD
- AUDCHF
- AUDJPY
- AUDUSD
- EURCAD
- EURCHF
- EURGBP
- EURJPY
- EURNZD
- EURRUB
- EURUSD
- GBPAUD
- GBPCHF
- GBPJPY
- GBPUSD
- GOLD
- NZDCAD
- NZDCHF
- NZDJPY
- NZDUSD
- SILVER
- USDCAD
- USDCHF
- USDJPY
- USDRUB
- All
- M5
- M15
- M30
- H1
- D1
- All
- Buy
- Sale
- All
- 1
- 2
- 3
- 4
- 5
was formed on 23.04 at 21:30:52 (UTC+0)
signal strength 2 of 5
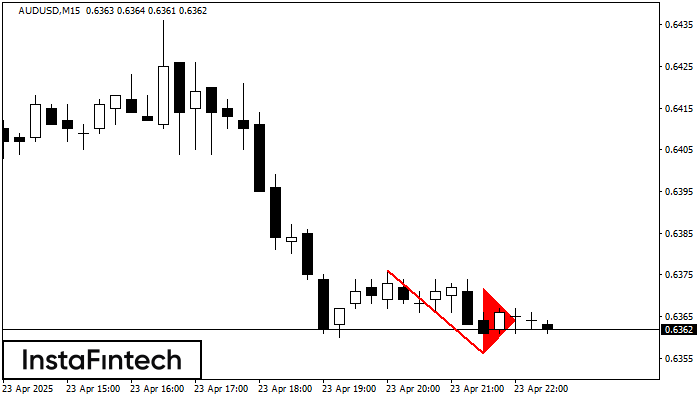
รูปแบบ รูปแบบกราฟธงปลายแหลมขาลง (Bearish pennant) ได้สร้างขึ้นมาในชาร์ต AUDUSD M15 มันแสดงถึงความต่อเนื่องของแนวโน้มปัจจุบัน คุณลักษณะจำเพาะ: ระดับต่ำของรูปแบบนี้จะเป็นพิกัดของ 0.6356;การประมาณการความสูงของตัวเสาธง เท่ากับ 20 บี๊ป ในกรณีที่ราคาเคลื่อนตัวทะลุผ่านระดับต่ำของรูปแบบนี้ที่
ขอบเตระยะเวลาใน M5 และ M15 อาจจะมีตำแหน่งการเข้าใช้งานที่ผิดพลาดมากยิ่งขึ้น
Open chart in a new window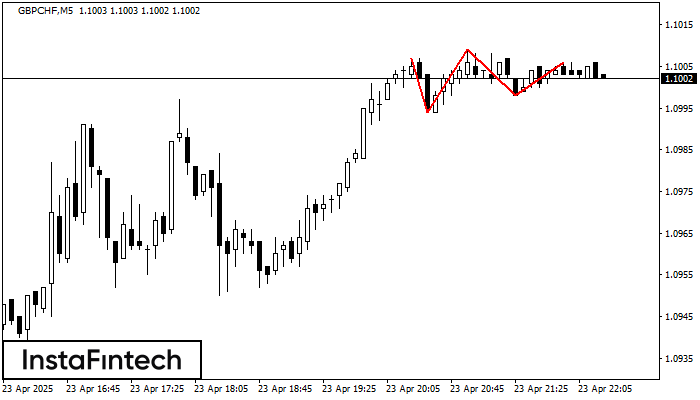
ในชาร์ตของตราสารการซื้อขาย GBPCHF M5 กราฟรูปแบบ รูปแบบกราฟจุดสามยอด (Triple Top) ที่แสดงให้เห็นถึง การเปลี่ยนแปลงของแนวโน้มที่ถูกสร้างขึ้นมา มันเป็นไปได้ที่ หลังจากการก่อตัวของระดับสูงสุดอันดับสามมาแล้ว ราคาจะพยายามเคลื่อนตัวทะลุผ่านระดับของแนวต้าน 1.0994 ที่พวกเราแนะนำให้เปิดสถานะการเทรดไว้เพื่อเป็นการขาย ตำแหน่งการทำกำไรเป็นระยะทางของความกว้างในกราฟรูปแบบนี้
ขอบเตระยะเวลาใน M5 และ M15 อาจจะมีตำแหน่งการเข้าใช้งานที่ผิดพลาดมากยิ่งขึ้น
Open chart in a new window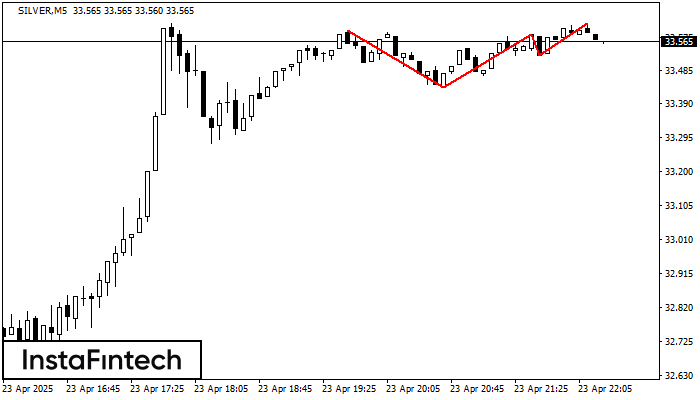
รูปแบบ รูปแบบกราฟจุดสามยอด (Triple Top) ได้สร้างขึ้นมาในชาร์ตของ SILVER M5 คุณลักษณะของกราฟรูปแบบนี้: ขอบเขตมีมุมหงายขึ้น; เส้นด้านล่างของกราฟรูปแบบนี้มีพิกัดอยู่ที่ 33.44/33.52 พร้อมกับลิมิตขาขึ้น 33.59/33.62; ระยะของความกว้างคือ
ขอบเตระยะเวลาใน M5 และ M15 อาจจะมีตำแหน่งการเข้าใช้งานที่ผิดพลาดมากยิ่งขึ้น
Open chart in a new window


